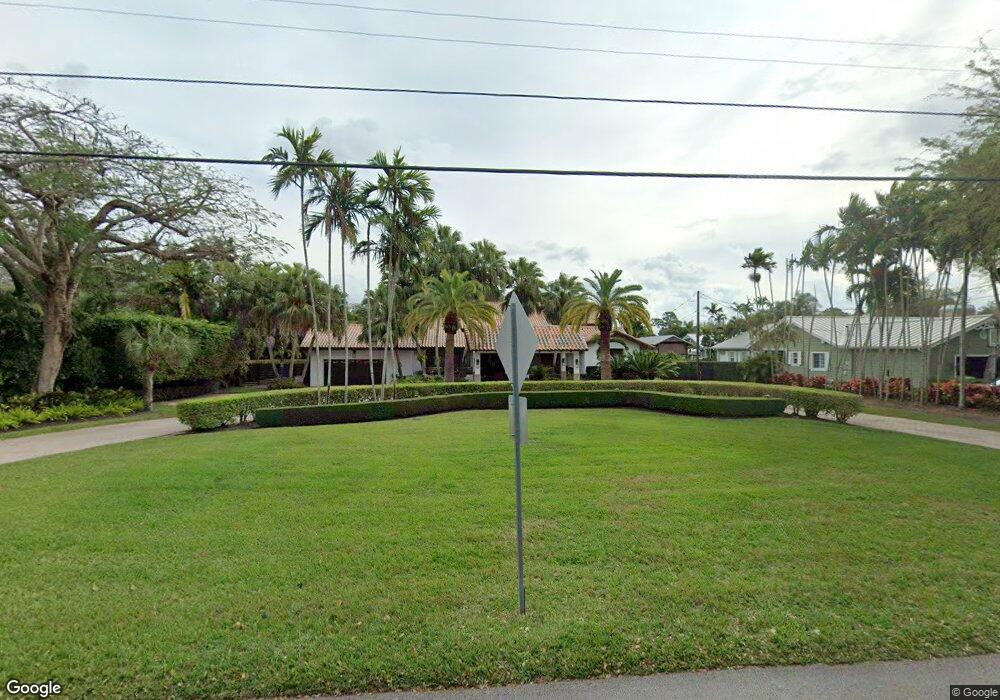
6421 SW 73rd Ct Miami, FL 33143
Glenvar Heights NeighborhoodEstimated Value: $2,811,000 - $2,970,413
4
Beds
4
Baths
4,028
Sq Ft
$714/Sq Ft
Est. Value
About This Home
This home is located at 6421 SW 73rd Ct, Miami, FL 33143 and is currently estimated at $2,876,853, approximately $714 per square foot. 6421 SW 73rd Ct is a home located in Miami-Dade County with nearby schools including South Miami K-8 Center, South Miami Middle School, and South Miami Senior High School.
Ownership History
Date
Name
Owned For
Owner Type
Purchase Details
Closed on
Apr 9, 2021
Sold by
Rimland Michael K and Torres Sandra I
Bought by
Rimland Michael K and Torres Sandra I
Current Estimated Value
Purchase Details
Closed on
Apr 23, 2010
Sold by
Padron Olga
Bought by
Rimland Michael K
Home Financials for this Owner
Home Financials are based on the most recent Mortgage that was taken out on this home.
Original Mortgage
$480,000
Outstanding Balance
$214,491
Interest Rate
2.12%
Mortgage Type
New Conventional
Estimated Equity
$2,662,362
Purchase Details
Closed on
Aug 22, 2008
Sold by
Padron Otto and Padron Olga
Bought by
Padron Olga
Purchase Details
Closed on
Jun 8, 2000
Sold by
State Street Bank & Trust Co
Bought by
Padron Otto and Padron Olga
Purchase Details
Closed on
Dec 26, 1996
Sold by
Ricardo and Elortegui Martha F
Bought by
Elortegui Rafael
Home Financials for this Owner
Home Financials are based on the most recent Mortgage that was taken out on this home.
Original Mortgage
$465,000
Interest Rate
7.57%
Mortgage Type
New Conventional
Create a Home Valuation Report for This Property
The Home Valuation Report is an in-depth analysis detailing your home's value as well as a comparison with similar homes in the area
Home Values in the Area
Average Home Value in this Area
Purchase History
| Date | Buyer | Sale Price | Title Company |
|---|---|---|---|
| Rimland Michael K | -- | Attorney | |
| Rimland Michael K | $820,000 | Attorney | |
| Padron Olga | -- | Attorney | |
| Padron Otto | $460,000 | -- | |
| Elortegui Rafael | $620,000 | -- |
Source: Public Records
Mortgage History
| Date | Status | Borrower | Loan Amount |
|---|---|---|---|
| Open | Rimland Michael K | $480,000 | |
| Previous Owner | Elortegui Rafael | $465,000 |
Source: Public Records
Tax History Compared to Growth
Tax History
| Year | Tax Paid | Tax Assessment Tax Assessment Total Assessment is a certain percentage of the fair market value that is determined by local assessors to be the total taxable value of land and additions on the property. | Land | Improvement |
|---|---|---|---|---|
| 2025 | $14,329 | $869,066 | -- | -- |
| 2024 | $13,127 | $844,574 | -- | -- |
| 2023 | $13,127 | $777,811 | $0 | $0 |
| 2022 | $12,692 | $755,157 | $0 | $0 |
| 2021 | $12,379 | $715,678 | $0 | $0 |
| 2020 | $12,242 | $705,797 | $0 | $0 |
| 2019 | $11,993 | $689,929 | $0 | $0 |
| 2018 | $11,458 | $677,065 | $0 | $0 |
| 2017 | $11,375 | $663,140 | $0 | $0 |
| 2016 | $11,348 | $649,501 | $0 | $0 |
| 2015 | $11,492 | $644,987 | $0 | $0 |
| 2014 | -- | $639,869 | $0 | $0 |
Source: Public Records
Map
Nearby Homes
- 6645 SW 73rd Ct
- 6850 SW 73rd Ct
- 62 Ave SW 66th St
- 6900 SW 72nd Ct
- 6129 SW 74th Ct
- 6820 SW 71st Ct
- 7550 SW 60th St
- 7001 SW 71st Ave
- 6867 SW 62nd Terrace
- 5928 SW 69th Ave
- 7521 SW 57th Terrace
- 7340 SW 56th St
- 6981 SW 58th St
- 6767 SW 67th St
- 5600 SW 74th Ct
- 7150 SW 77th Place
- 7171 Miller Dr Unit 1
- 5644 SW 69th Ave
- 7150 SW 55th Terrace W
- 5570 SW 70th Place S
- 6401 SW 73rd Ct
- 6501 SW 73rd Ct
- 7321 SW 64th Ct
- 6511 SW 73rd Ct
- 6400 SW 72nd Ct
- 6490 SW 72nd Ct
- 6430 SW 73rd Ct
- 6460 SW 73rd Ct
- 6460 SW 73rd Ct
- 7350 SW 64th St
- 6545 SW 73rd Ct
- 6520 SW 72nd Ct
- 6520 SW 72 Ct
- 6450 SW 72nd Ct
- 6520 SW 73rd Ct
- 6440 SW 72nd Ct
- 6440 SW 72nd Ct
- 6530 SW 72nd Ct
- 6601 SW 73rd Ct
- 6544 SW 73rd Ct