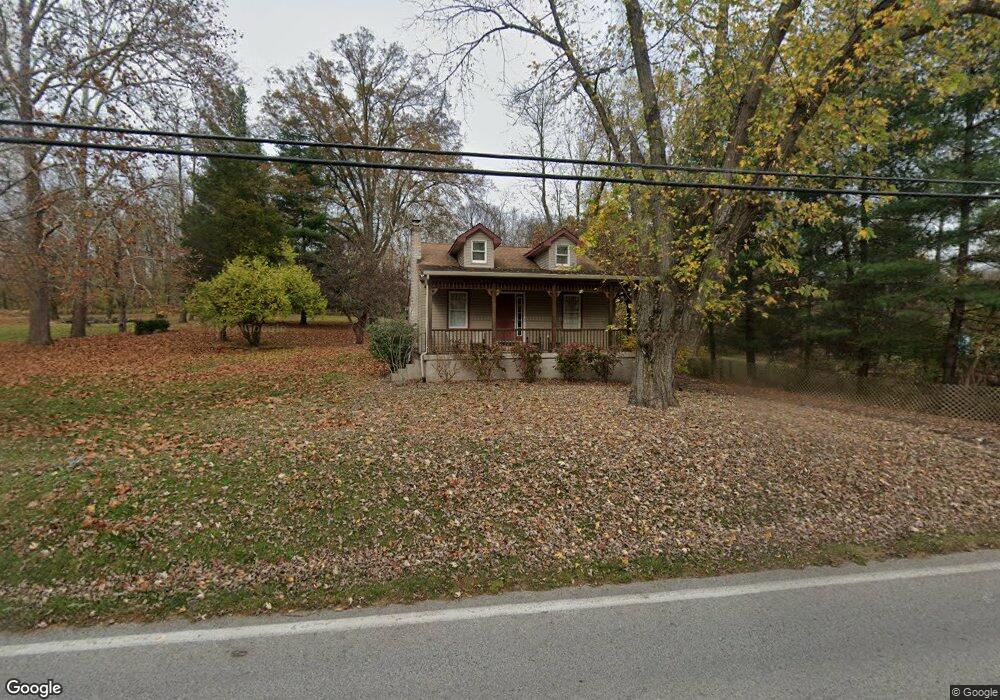
6424 Wesselman Rd Cincinnati, OH 45248
Estimated Value: $215,000 - $271,000
3
Beds
1
Bath
1,204
Sq Ft
$198/Sq Ft
Est. Value
About This Home
This home is located at 6424 Wesselman Rd, Cincinnati, OH 45248 and is currently estimated at $238,935, approximately $198 per square foot. 6424 Wesselman Rd is a home located in Hamilton County with nearby schools including Charles W Springmyer Elementary School, Bridgetown Middle School, and Oak Hills High School.
Ownership History
Date
Name
Owned For
Owner Type
Purchase Details
Closed on
Jun 22, 2012
Sold by
Dalessandro Linda E and Dalessandro John D
Bought by
Claypoole Frank and Claypoole Linda A
Current Estimated Value
Purchase Details
Closed on
Feb 28, 2005
Sold by
Vickers Sandra L and Wilkinson Martha Jane
Bought by
Dalessandro Linda E
Home Financials for this Owner
Home Financials are based on the most recent Mortgage that was taken out on this home.
Original Mortgage
$81,600
Interest Rate
5.7%
Mortgage Type
Unknown
Purchase Details
Closed on
Nov 12, 2003
Sold by
Lesser Richard F
Bought by
Vickers Sandra L and Wilkinson Martha Jane
Home Financials for this Owner
Home Financials are based on the most recent Mortgage that was taken out on this home.
Original Mortgage
$63,750
Interest Rate
6.1%
Mortgage Type
Unknown
Create a Home Valuation Report for This Property
The Home Valuation Report is an in-depth analysis detailing your home's value as well as a comparison with similar homes in the area
Home Values in the Area
Average Home Value in this Area
Purchase History
| Date | Buyer | Sale Price | Title Company |
|---|---|---|---|
| Claypoole Frank | -- | Attorney | |
| Dalessandro Linda E | $102,000 | Prodigy Title Agency Llc | |
| Vickers Sandra L | $85,000 | Jets Title Agency Llc |
Source: Public Records
Mortgage History
| Date | Status | Borrower | Loan Amount |
|---|---|---|---|
| Previous Owner | Dalessandro Linda E | $81,600 | |
| Previous Owner | Vickers Sandra L | $63,750 |
Source: Public Records
Tax History
| Year | Tax Paid | Tax Assessment Tax Assessment Total Assessment is a certain percentage of the fair market value that is determined by local assessors to be the total taxable value of land and additions on the property. | Land | Improvement |
|---|---|---|---|---|
| 2025 | $3,373 | $63,092 | $21,298 | $41,794 |
| 2024 | $3,381 | $63,092 | $21,298 | $41,794 |
| 2023 | $3,323 | $63,092 | $21,298 | $41,794 |
| 2022 | $2,923 | $47,181 | $20,745 | $26,436 |
| 2021 | $2,686 | $47,181 | $20,745 | $26,436 |
| 2020 | $2,655 | $47,181 | $20,745 | $26,436 |
| 2019 | $2,610 | $42,126 | $18,522 | $23,604 |
| 2018 | $2,612 | $42,126 | $18,522 | $23,604 |
| 2017 | $2,495 | $42,126 | $18,522 | $23,604 |
| 2016 | $2,268 | $37,801 | $17,770 | $20,031 |
| 2015 | $2,257 | $37,801 | $17,770 | $20,031 |
| 2014 | $2,256 | $37,801 | $17,770 | $20,031 |
| 2013 | $2,301 | $41,199 | $18,704 | $22,495 |
Source: Public Records
Map
Nearby Homes
- 6989 Carlinridge Ln
- 5703 Irwin Dr
- 5779 Irwin Dr
- 5771 Irwin Dr
- 5767 Irwin Dr
- 6289 Eagles Lake Dr
- 6321 Eagles Lake Dr Unit 19
- 6646 Hearne Rd
- 5207 S Eaglesnest Dr
- 6617 Hearne Rd
- 6586 Hearne Rd Unit 2T
- 6074 Johnson Rd
- 5310 Rybolt Rd
- 5221 Clearlake Dr
- 5104 Jonkard Ln
- 4510 Clearwater Place
- 4512 Clearwater Place
- 6793 Jennifer Lynn Dr
- 3105 Laurel Hill Ln
- 5442 Bluesky Dr
- 6438 Wesselman Rd
- 6412 Wesselman Rd
- 6396 Wesselman Rd
- 6454 Wesselman Rd
- 6464 Wesselman Rd
- 4863 Ebenezer Rd
- 6386 Wesselman Rd
- 6501 Wesselman Rd
- 4846 Ebenezer Rd
- 4833 Ebenezer Rd
- 6511 Wesselman Rd
- 6508 Wesselman Rd
- 4820 Ebenezer Rd
- 4821 Ebenezer Rd
- 4950 Ebenezer Rd
- 6519 Wesselman Rd
- 6551 Wesselman Rd
- 6331 Wesselman Rd
- 4814 Ebenezer Rd
- 4805 Ebenezer Rd
Your Personal Tour Guide
Ask me questions while you tour the home.