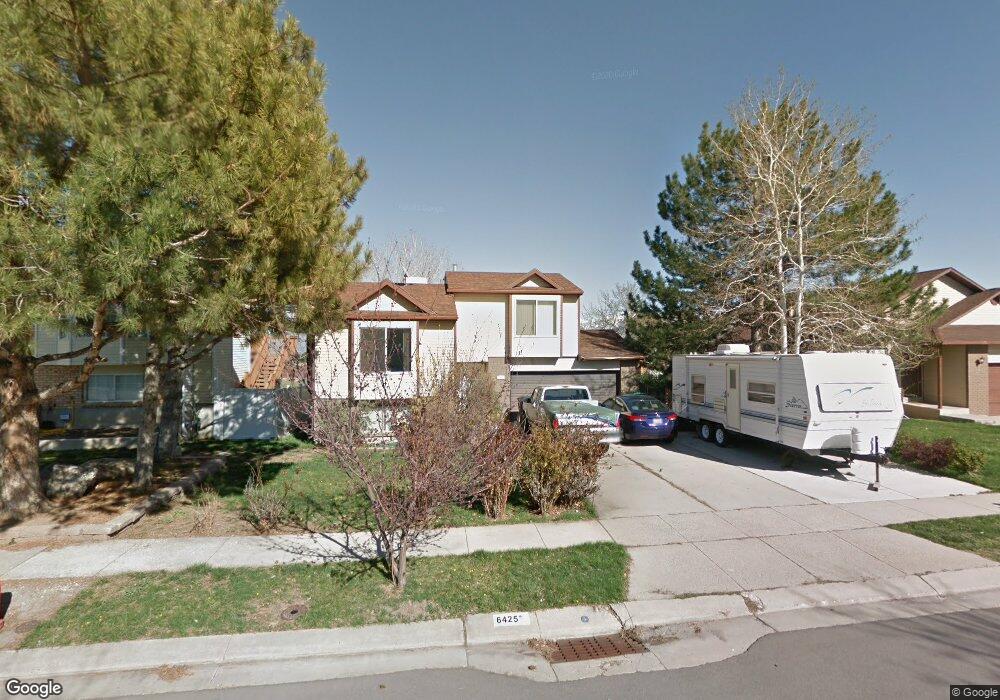
6425 Lotus Way West Jordan, UT 84081
Oquirrh NeighborhoodEstimated Value: $406,000 - $442,953
2
Beds
1
Bath
985
Sq Ft
$433/Sq Ft
Est. Value
About This Home
This home is located at 6425 Lotus Way, West Jordan, UT 84081 and is currently estimated at $426,238, approximately $432 per square foot. 6425 Lotus Way is a home located in Salt Lake County with nearby schools including Jim Bridger Elementary School, Thomas Jefferson Jr High School, and Kearns High School.
Ownership History
Date
Name
Owned For
Owner Type
Purchase Details
Closed on
Jun 9, 2021
Sold by
Jones Ladonna Earl and Jones Earl Ladonna
Bought by
Jones Ladonna Earl and Jones Sean
Current Estimated Value
Home Financials for this Owner
Home Financials are based on the most recent Mortgage that was taken out on this home.
Original Mortgage
$155,000
Outstanding Balance
$140,027
Interest Rate
2.9%
Mortgage Type
New Conventional
Estimated Equity
$286,211
Purchase Details
Closed on
Oct 22, 2007
Sold by
Earl Ladonna K
Bought by
Earl Ladonna
Home Financials for this Owner
Home Financials are based on the most recent Mortgage that was taken out on this home.
Original Mortgage
$144,130
Interest Rate
6.27%
Mortgage Type
New Conventional
Purchase Details
Closed on
May 19, 1995
Sold by
Murdock Garrick G and Murdock Monica R
Bought by
Earl Ladonna K
Home Financials for this Owner
Home Financials are based on the most recent Mortgage that was taken out on this home.
Original Mortgage
$67,500
Interest Rate
8.51%
Create a Home Valuation Report for This Property
The Home Valuation Report is an in-depth analysis detailing your home's value as well as a comparison with similar homes in the area
Home Values in the Area
Average Home Value in this Area
Purchase History
| Date | Buyer | Sale Price | Title Company |
|---|---|---|---|
| Jones Ladonna Earl | -- | Closing Usa Llc | |
| Earl Ladonna | -- | Surety Title | |
| Earl Ladonna K | -- | -- |
Source: Public Records
Mortgage History
| Date | Status | Borrower | Loan Amount |
|---|---|---|---|
| Open | Jones Ladonna Earl | $155,000 | |
| Closed | Earl Ladonna | $144,130 | |
| Closed | Earl Ladonna K | $67,500 |
Source: Public Records
Tax History Compared to Growth
Tax History
| Year | Tax Paid | Tax Assessment Tax Assessment Total Assessment is a certain percentage of the fair market value that is determined by local assessors to be the total taxable value of land and additions on the property. | Land | Improvement |
|---|---|---|---|---|
| 2025 | $2,451 | $409,000 | $100,400 | $308,600 |
| 2024 | $2,451 | $386,400 | $94,700 | $291,700 |
| 2023 | $2,451 | $363,500 | $91,000 | $272,500 |
| 2022 | $2,393 | $365,400 | $89,300 | $276,100 |
| 2021 | $2,188 | $297,000 | $68,700 | $228,300 |
| 2020 | $2,011 | $258,000 | $68,700 | $189,300 |
| 2019 | $1,983 | $247,100 | $64,800 | $182,300 |
| 2018 | $1,891 | $227,500 | $64,800 | $162,700 |
| 2017 | $1,566 | $198,300 | $64,800 | $133,500 |
| 2016 | $1,451 | $182,500 | $64,800 | $117,700 |
| 2015 | $1,349 | $158,000 | $64,600 | $93,400 |
| 2014 | $1,323 | $152,000 | $62,700 | $89,300 |
Source: Public Records
Map
Nearby Homes
- 6489 S Daffodil Way
- 5557 W Joshua Cir
- 5382 W Northlilac Ave
- 5732 W Moon Crest Ct
- 6739 S Sol Rise Dr
- 6721 Adventure Way
- 5627 Walnut Ridge Cir
- 5352 Cassatt Cir
- 6568 S 5180 W
- 5281 Saguaro Dr
- 5581 Bluevail Ct
- 6698 Early Dawn Dr
- 5466 Ticklegrass Rd
- 5183 W Cadenza Dr
- 6149 Trowbridge Way
- 6839 S Cyclamen Dr
- 6157 S Impressions Dr
- 6853 Mullien Dr Unit 5420
- 5285 Ridge Flower Way
- 5275 Ridge Flower Way
- 6435 Lotus Way
- 6417 Lotus Way
- 6417 S Lotus Way
- 5498 Cyclamen Cove
- 5498 W Cyclamen Cove
- 5500 Cyclamen Cove
- 6407 Lotus Way
- 6443 S Lotus Way
- 6407 S Lotus Way
- 6443 Lotus Way
- 5496 Cyclamen Cove
- 6428 Lotus Way
- 6428 S Lotus Way
- 5496 W Cyclamen Cove
- 5501 W Cyclamen Cove
- 5547 Cornflower Cir
- 5547 W Cornflower Cir
- 5501 Cyclamen Cove
- 6399 Lotus Way
- 5494 W Cyclamen Cove