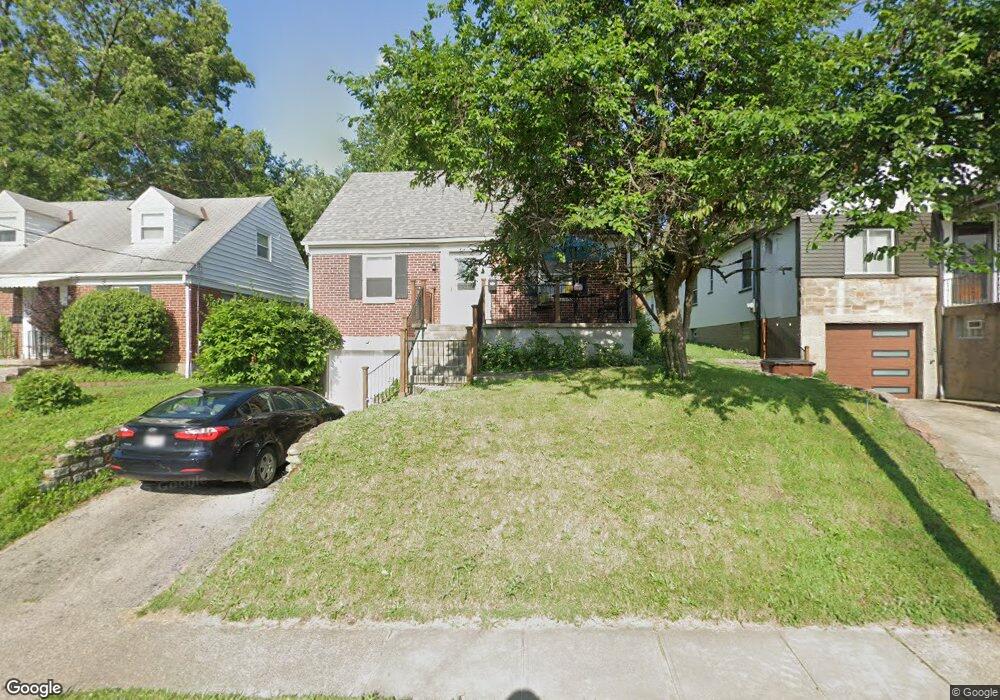
6426 Hammel Ave Cincinnati, OH 45237
Estimated Value: $154,000 - $181,000
2
Beds
2
Baths
966
Sq Ft
$168/Sq Ft
Est. Value
About This Home
This home is located at 6426 Hammel Ave, Cincinnati, OH 45237 and is currently estimated at $162,738, approximately $168 per square foot. 6426 Hammel Ave is a home located in Hamilton County with nearby schools including Pleasant Ridge Montessori School, Shroder High School, and Clark Montessori High School.
Ownership History
Date
Name
Owned For
Owner Type
Purchase Details
Closed on
Jun 11, 2020
Sold by
Barnes Christopher P and Barnes Catherine A
Bought by
Tahoe Real Estate Illyestmdllts Llc
Current Estimated Value
Purchase Details
Closed on
Nov 18, 2017
Sold by
Betsch John E
Bought by
Greener Side Properties Llc
Purchase Details
Closed on
Sep 12, 2006
Sold by
Clayton Investment Corp
Bought by
Barnes Christopher D
Home Financials for this Owner
Home Financials are based on the most recent Mortgage that was taken out on this home.
Original Mortgage
$73,500
Interest Rate
6.59%
Mortgage Type
Unknown
Purchase Details
Closed on
Aug 21, 1997
Sold by
Gellman Kate
Bought by
Haley Margaret A
Home Financials for this Owner
Home Financials are based on the most recent Mortgage that was taken out on this home.
Original Mortgage
$59,500
Interest Rate
7.56%
Create a Home Valuation Report for This Property
The Home Valuation Report is an in-depth analysis detailing your home's value as well as a comparison with similar homes in the area
Home Values in the Area
Average Home Value in this Area
Purchase History
We collect this data history from publicly available records. To have your information removed, we recommend requesting removal directly through your county’s website.
| Date | Buyer | Sale Price | Title Company |
|---|---|---|---|
| Tahoe Real Estate Illyestmdllts Llc | $59,000 | None Available | |
| Greener Side Properties Llc | -- | None Available | |
| Barnes Christopher D | $73,500 | Lawyers Title Of Cincinnati | |
| Haley Margaret A | $70,000 | -- |
Source: Public Records
Mortgage History
We collect this data history from publicly available records. To have your information removed, we recommend requesting removal directly through your county’s website.
| Date | Status | Borrower | Loan Amount |
|---|---|---|---|
| Previous Owner | Barnes Christopher D | $73,500 | |
| Previous Owner | Haley Margaret A | $59,500 |
Source: Public Records
Tax History
| Year | Tax Paid | Tax Assessment Tax Assessment Total Assessment is a certain percentage of the fair market value that is determined by local assessors to be the total taxable value of land and additions on the property. | Land | Improvement |
|---|---|---|---|---|
| 2025 | $2,802 | $38,014 | $8,841 | $29,173 |
| 2024 | $2,798 | $38,014 | $8,841 | $29,173 |
| 2023 | $2,802 | $38,014 | $8,841 | $29,173 |
| 2022 | $1,943 | $20,651 | $5,709 | $14,942 |
| 2021 | $1,931 | $20,651 | $5,709 | $14,942 |
| 2020 | $1,915 | $20,651 | $5,709 | $14,942 |
| 2019 | $2,105 | $19,975 | $5,051 | $14,924 |
| 2018 | $2,067 | $19,975 | $5,051 | $14,924 |
| 2017 | $2,032 | $19,975 | $5,051 | $14,924 |
| 2016 | $2,000 | $19,250 | $5,614 | $13,636 |
| 2015 | $1,843 | $19,250 | $5,614 | $13,636 |
| 2014 | $1,753 | $19,250 | $5,614 | $13,636 |
| 2013 | $1,770 | $19,250 | $5,614 | $13,636 |
Source: Public Records
Map
Nearby Homes
- 2507 Kellerman Ave
- 2345 Losantiville Ave
- 2425 Saint Albans Ave
- 2370 Losantiville Ave
- 6330 Elbrook Ave
- 2537 Vera Ave
- 2539 Vera Ave
- 2541 Vera Ave
- 2543 Vera Ave
- 6419 Stover Ave
- 2652 Cedarbrook Dr
- 6331 Stover Ave
- 2656 Cedarbrook Dr
- 6771 Elbrook Ave
- 6110 Stover Ave
- 2364 Langdon Farm Rd
- 6300 Lisbon Ave
- 7260 Eastlawn Dr
- 7119 Eastlawn Dr
- 2819 Cortelyou Place
- 6420 Hammel Ave
- 6434 Hammel Ave
- 6418 Hammel Ave
- 6436 Hammel Ave
- 2417 Kellerman Ave
- 6414 Hammel Ave
- 6438 Hammel Ave
- 2416 Kellerman Ave
- 6410 Hammel Ave
- 6442 Hammel Ave
- 2419 Kellerman Ave
- 2418 Kellerman Ave
- 6427 Hammel Ave
- 6431 Hammel Ave
- 6423 Hammel Ave
- 6406 Hammel Ave
- 2421 Kellerman Ave
- 6446 Hammel Ave
- 6419 Hammel Ave
- 2420 Kellerman Ave
Your Personal Tour Guide
Ask me questions while you tour the home.