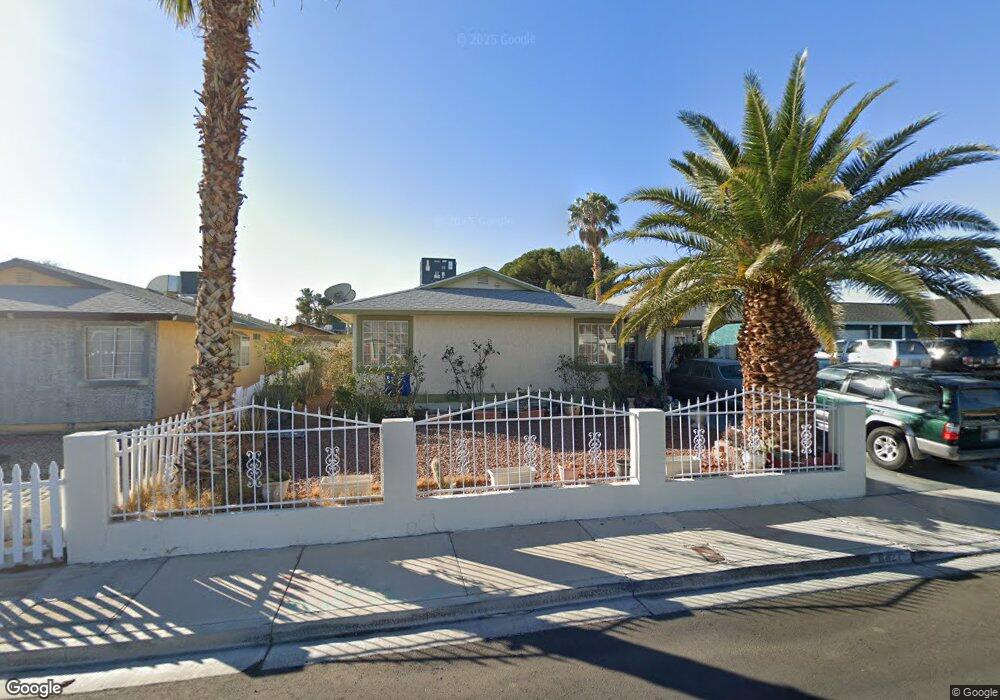
6427 Pawlow Ave Unit 1 Las Vegas, NV 89118
Estimated Value: $396,000 - $454,000
4
Beds
2
Baths
1,780
Sq Ft
$238/Sq Ft
Est. Value
About This Home
This home is located at 6427 Pawlow Ave Unit 1, Las Vegas, NV 89118 and is currently estimated at $424,509, approximately $238 per square foot. 6427 Pawlow Ave Unit 1 is a home located in Clark County with nearby schools including Marion B Earl Elementary School, Grant Sawyer Middle School, and Durango High School.
Ownership History
Date
Name
Owned For
Owner Type
Purchase Details
Closed on
Sep 12, 2011
Sold by
Perera Winitha
Bought by
Perera Nawagamuwage D
Current Estimated Value
Purchase Details
Closed on
Sep 8, 2011
Sold by
Perera Nawagamuwage D
Bought by
Deguzman Arthur S and Badiola Zenaida L
Purchase Details
Closed on
Mar 8, 2000
Sold by
Cit Group Consumer Finance Inc
Bought by
Perera Nawagamuwage D
Home Financials for this Owner
Home Financials are based on the most recent Mortgage that was taken out on this home.
Original Mortgage
$116,109
Interest Rate
8.34%
Purchase Details
Closed on
Nov 4, 1999
Sold by
Eversole John and Eversole Lillian
Bought by
The Cit Group Consumer Finance Inc
Create a Home Valuation Report for This Property
The Home Valuation Report is an in-depth analysis detailing your home's value as well as a comparison with similar homes in the area
Home Values in the Area
Average Home Value in this Area
Purchase History
| Date | Buyer | Sale Price | Title Company |
|---|---|---|---|
| Perera Nawagamuwage D | -- | Chicago Title Las Vegas | |
| Deguzman Arthur S | $85,000 | Chicago Title Las Vegas | |
| Perera Nawagamuwage D | $119,700 | Nevada Title Company | |
| The Cit Group Consumer Finance Inc | -- | United Title |
Source: Public Records
Mortgage History
| Date | Status | Borrower | Loan Amount |
|---|---|---|---|
| Previous Owner | Perera Nawagamuwage D | $116,109 |
Source: Public Records
Tax History Compared to Growth
Tax History
| Year | Tax Paid | Tax Assessment Tax Assessment Total Assessment is a certain percentage of the fair market value that is determined by local assessors to be the total taxable value of land and additions on the property. | Land | Improvement |
|---|---|---|---|---|
| 2025 | $1,491 | $69,520 | $34,020 | $35,500 |
| 2024 | $1,448 | $69,520 | $34,020 | $35,500 |
| 2023 | $1,448 | $66,676 | $31,500 | $35,176 |
| 2022 | $1,406 | $59,817 | $26,775 | $33,042 |
| 2021 | $1,365 | $54,717 | $22,680 | $32,037 |
| 2020 | $1,322 | $55,099 | $22,680 | $32,419 |
| 2019 | $1,284 | $51,453 | $18,900 | $32,553 |
| 2018 | $1,229 | $50,132 | $18,900 | $31,232 |
| 2017 | $1,478 | $50,391 | $18,200 | $32,191 |
| 2016 | $1,165 | $45,938 | $12,600 | $33,338 |
| 2015 | $1,162 | $45,341 | $12,250 | $33,091 |
| 2014 | $1,128 | $39,713 | $8,750 | $30,963 |
Source: Public Records
Map
Nearby Homes
- 6420 Aclare Ave
- 6428 Crystal Dew Dr
- 6358 Elmira Dr
- 4893 S Torrey Pines Dr Unit 202
- 4835 S Torrey Pines Dr Unit 104
- 4805 S Torrey Pines Dr Unit 201
- 4805 S Torrey Pines Dr Unit 101
- 5195 Sepulveda Blvd
- 4847 S Torrey Pines Dr Unit 102
- 4855 S Torrey Pines Dr Unit 102
- 6643 W Tropicana Ave Unit 102
- 6671 W Tropicana Ave Unit 103
- 4861 S Torrey Pines Dr Unit 106
- 6645 W Tropicana Ave Unit 104
- 4865 S Torrey Pines Dr Unit 106
- 5255 Autumn Sky Rd
- 6401 Derek Dr
- 5201 S Torrey Pines Dr Unit 1239
- 5201 S Torrey Pines Dr Unit 1227
- 5038 S Rainbow Blvd Unit 206
- 6419 Pawlow Ave
- 6437 Pawlow Ave
- 6428 Aclare Ave
- 6438 Aclare Ave
- 6409 Pawlow Ave
- 6447 Pawlow Ave Unit 1
- 6426 Pawlow Ave
- 6448 Aclare Ave
- 6410 Aclare Ave Unit 1
- 6436 Pawlow Ave
- 6418 Pawlow Ave
- 6401 Pawlow Ave
- 6446 Pawlow Ave
- 6408 Pawlow Ave
- 6402 Aclare Ave
- 6458 Aclare Ave
- 6456 Pawlow Ave Unit 1
- 6400 Pawlow Ave
- 6391 Pawlow Ave