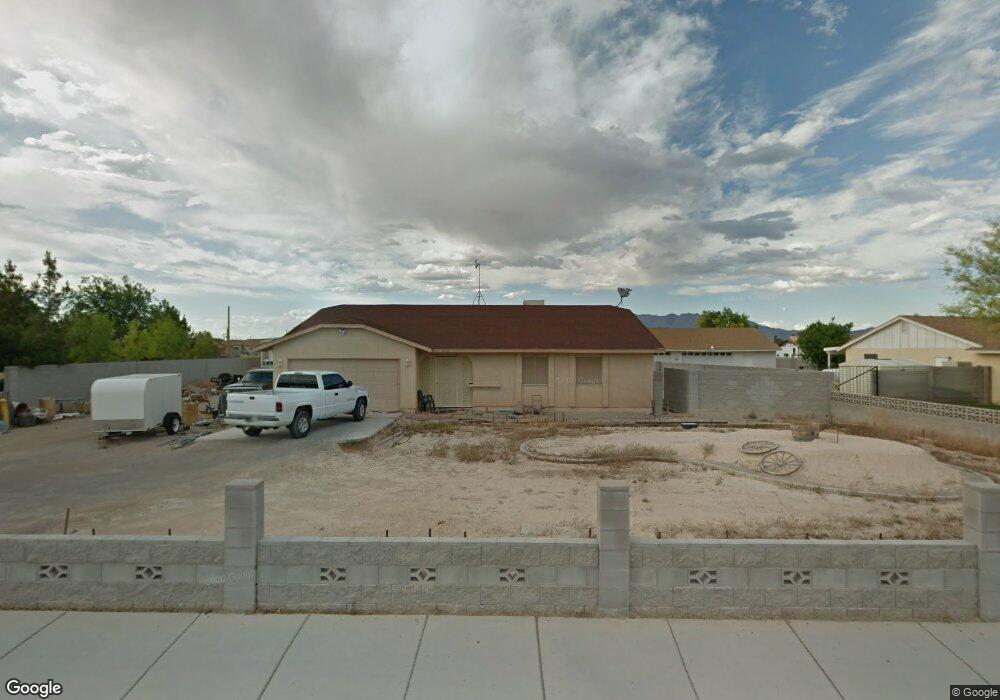
6428 W Ann Rd Las Vegas, NV 89130
North Cheyenne NeighborhoodEstimated Value: $485,000 - $550,000
3
Beds
2
Baths
1,800
Sq Ft
$294/Sq Ft
Est. Value
About This Home
This home is located at 6428 W Ann Rd, Las Vegas, NV 89130 and is currently estimated at $528,552, approximately $293 per square foot. 6428 W Ann Rd is a home located in Clark County with nearby schools including Joseph M Neal Elementary School, Anthony Saville Middle School, and Shadow Ridge High School.
Ownership History
Date
Name
Owned For
Owner Type
Purchase Details
Closed on
Aug 31, 2017
Sold by
Dodson Lisa and Dodson Johnny Lee
Bought by
Dodson Lisa
Current Estimated Value
Purchase Details
Closed on
Jul 27, 2012
Sold by
Cameron Lisa J and Dodson Johnny L
Bought by
Dodson Lisa J and Dodson Johnny L
Purchase Details
Closed on
Apr 17, 2000
Sold by
Busch Darleen E
Bought by
Cameron Lisa J and Dodson Johnny L
Home Financials for this Owner
Home Financials are based on the most recent Mortgage that was taken out on this home.
Original Mortgage
$161,490
Interest Rate
8.24%
Purchase Details
Closed on
Sep 17, 1998
Sold by
Decuir Julian A and Decuir Brenda Sue
Bought by
Busch Darleen E
Home Financials for this Owner
Home Financials are based on the most recent Mortgage that was taken out on this home.
Original Mortgage
$135,150
Interest Rate
6.88%
Create a Home Valuation Report for This Property
The Home Valuation Report is an in-depth analysis detailing your home's value as well as a comparison with similar homes in the area
Home Values in the Area
Average Home Value in this Area
Purchase History
| Date | Buyer | Sale Price | Title Company |
|---|---|---|---|
| Dodson Lisa | -- | None Available | |
| The Jllgs Trust | -- | None Available | |
| Dodson Lisa J | -- | None Available | |
| Cameron Lisa J | $169,990 | United Title | |
| Busch Darleen E | $142,500 | Fidelity National Title |
Source: Public Records
Mortgage History
| Date | Status | Borrower | Loan Amount |
|---|---|---|---|
| Previous Owner | Cameron Lisa J | $161,490 | |
| Previous Owner | Busch Darleen E | $135,150 |
Source: Public Records
Tax History Compared to Growth
Tax History
| Year | Tax Paid | Tax Assessment Tax Assessment Total Assessment is a certain percentage of the fair market value that is determined by local assessors to be the total taxable value of land and additions on the property. | Land | Improvement |
|---|---|---|---|---|
| 2025 | $1,819 | $118,901 | $61,250 | $57,651 |
| 2024 | $1,766 | $118,901 | $61,250 | $57,651 |
| 2023 | $1,766 | $110,893 | $56,000 | $54,893 |
| 2022 | $1,715 | $94,586 | $43,750 | $50,836 |
| 2021 | $1,665 | $90,758 | $42,000 | $48,758 |
| 2020 | $1,614 | $87,303 | $38,500 | $48,803 |
| 2019 | $1,567 | $74,659 | $26,250 | $48,409 |
| 2018 | $1,521 | $74,901 | $28,000 | $46,901 |
| 2017 | $2,387 | $74,129 | $26,250 | $47,879 |
| 2016 | $1,398 | $69,345 | $21,000 | $48,345 |
| 2015 | $1,438 | $59,677 | $19,250 | $40,427 |
| 2014 | $1,396 | $41,299 | $12,250 | $29,049 |
Source: Public Records
Map
Nearby Homes
- 6400 W Ann Rd
- 5635 Portage Lake Ct
- 6620 Gray Juniper Ave
- 6345 Cinnabar Ridge Ave
- 6405 Steamship Ct
- 6613 Sand Bench Ave
- 6345 Citrine Ave
- 6540 W Hammer Ln
- 6679 Alpine Brooks Ave
- 5508 Jasper Butte St
- 5329 Bright Sun Ct
- 6405 Break Point Ave
- 6513 Echo Crest Ave
- 5409 Flora Spray St
- 6301 Malachite Bay Ave
- 5512 Goldbrush St
- 5663 N Balsam St
- 5634 Bishop Flowers St
- 5816 Grand Heritage St
- 5712 Grand Guiness Ct