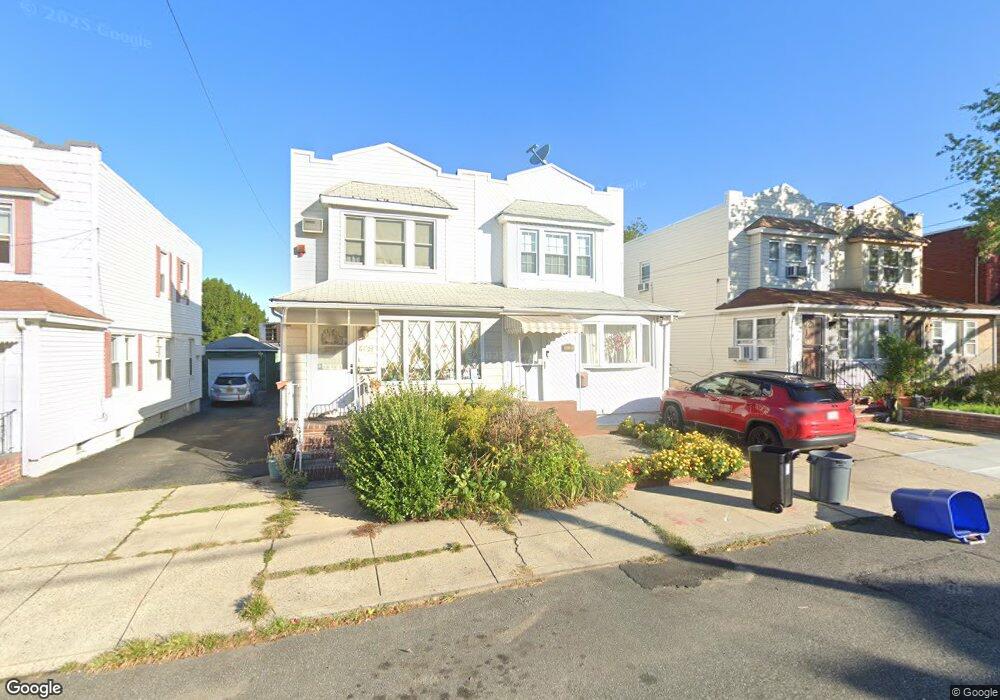
6429 60th Rd Maspeth, NY 11378
Maspeth NeighborhoodEstimated Value: $748,649 - $958,000
Studio
--
Bath
1,152
Sq Ft
$742/Sq Ft
Est. Value
About This Home
This home is located at 6429 60th Rd, Maspeth, NY 11378 and is currently estimated at $854,912, approximately $742 per square foot. 6429 60th Rd is a home located in Queens County with nearby schools including P.S. 153 Maspeth, IS 73 - The Frank Sansivieri School, and Grover Cleveland High School.
Ownership History
Date
Name
Owned For
Owner Type
Purchase Details
Closed on
Aug 29, 2013
Sold by
Garofalo Maria Elena and Patane Joseph A
Bought by
Mendez-Correa Rodrigo A and Mendez-Rodriguez Martha Yolanda
Current Estimated Value
Home Financials for this Owner
Home Financials are based on the most recent Mortgage that was taken out on this home.
Original Mortgage
$509,599
Outstanding Balance
$380,580
Interest Rate
4.42%
Mortgage Type
New Conventional
Estimated Equity
$474,332
Purchase Details
Closed on
Nov 22, 2000
Sold by
Hussain Aamer and Klewicka Milena
Bought by
Garofalo Maria Elena and Patane Joseph A
Home Financials for this Owner
Home Financials are based on the most recent Mortgage that was taken out on this home.
Original Mortgage
$225,000
Interest Rate
7.64%
Purchase Details
Closed on
Dec 29, 1995
Sold by
Gaffney Charles and Gaffney Jacqueline
Bought by
Hussain Aamer and Klewicka Milena
Home Financials for this Owner
Home Financials are based on the most recent Mortgage that was taken out on this home.
Original Mortgage
$162,450
Interest Rate
7.04%
Create a Home Valuation Report for This Property
The Home Valuation Report is an in-depth analysis detailing your home's value as well as a comparison with similar homes in the area
Home Values in the Area
Average Home Value in this Area
Purchase History
| Date | Buyer | Sale Price | Title Company |
|---|---|---|---|
| Mendez-Correa Rodrigo A | $519,000 | -- | |
| Garofalo Maria Elena | $250,000 | Stewart Title | |
| Hussain Aamer | $171,000 | -- |
Source: Public Records
Mortgage History
| Date | Status | Borrower | Loan Amount |
|---|---|---|---|
| Open | Mendez-Correa Rodrigo A | $509,599 | |
| Previous Owner | Garofalo Maria Elena | $225,000 | |
| Previous Owner | Hussain Aamer | $162,450 |
Source: Public Records
Tax History
| Year | Tax Paid | Tax Assessment Tax Assessment Total Assessment is a certain percentage of the fair market value that is determined by local assessors to be the total taxable value of land and additions on the property. | Land | Improvement |
|---|---|---|---|---|
| 2025 | $6,217 | $31,956 | $7,143 | $24,813 |
| 2024 | $6,217 | $30,954 | $6,736 | $24,218 |
| 2023 | $5,872 | $29,237 | $6,057 | $23,180 |
| 2022 | $5,579 | $46,380 | $10,380 | $36,000 |
| 2021 | $5,610 | $48,840 | $10,380 | $38,460 |
| 2020 | $5,637 | $47,580 | $10,380 | $37,200 |
| 2019 | $5,396 | $41,760 | $10,380 | $31,380 |
| 2018 | $4,967 | $24,364 | $6,701 | $17,663 |
| 2017 | $4,747 | $23,288 | $7,392 | $15,896 |
| 2016 | $4,441 | $23,288 | $7,392 | $15,896 |
| 2015 | $2,430 | $22,192 | $7,747 | $14,445 |
| 2014 | $2,430 | $21,496 | $8,953 | $12,543 |
Source: Public Records
Map
Nearby Homes
Your Personal Tour Guide
Ask me questions while you tour the home.