643 Moore St Myrtle Beach, SC 29577
Downtown Myrtle Beach NeighborhoodEstimated Value: $192,000 - $224,152
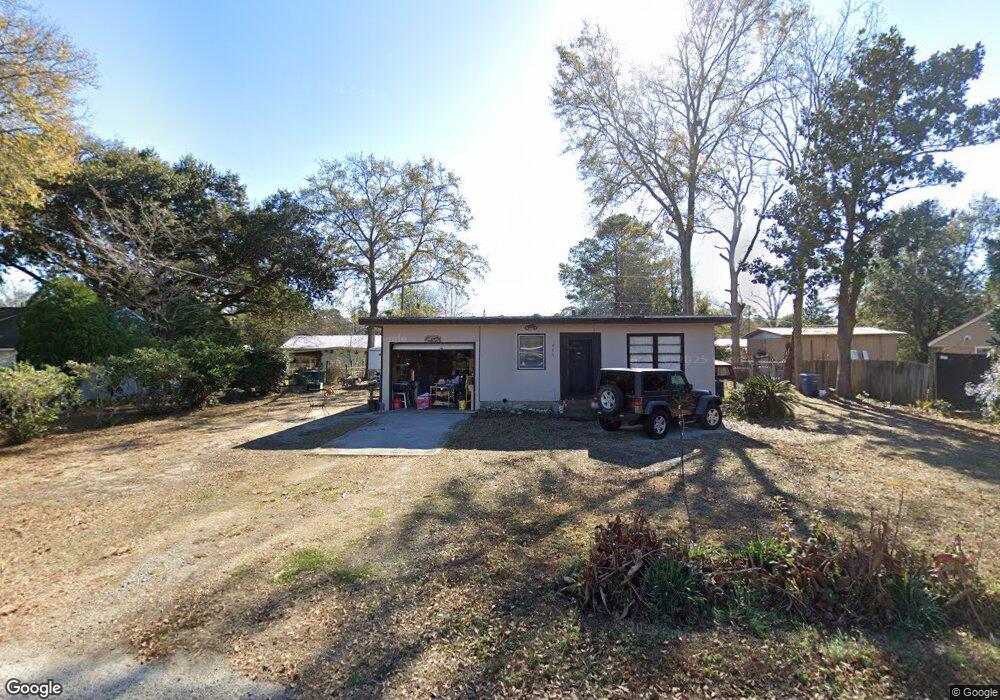
About This Home
This home is located at 643 Moore St, Myrtle Beach, SC 29577 and is currently estimated at $211,038, approximately $176 per square foot. 643 Moore St is a home located in Horry County with nearby schools including Myrtle Beach Child Development Center, Myrtle Beach Primary School, and Myrtle Beach Middle School.
Ownership History
We collect this data history from publicly available records. To have your information removed, we recommend requesting removal directly through your county’s website.
Purchase Details
Home Financials for this Owner
Home Financials are based on the most recent Mortgage that was taken out on this home.Purchase Details
Home Values in the Area
Average Home Value in this Area
Purchase History
We collect this data history from publicly available records. To have your information removed, we recommend requesting removal directly through your county’s website.
| Date | Buyer | Sale Price | Title Company |
|---|---|---|---|
| $77,500 | -- | ||
| -- | -- |
Mortgage History
We collect this data history from publicly available records. To have your information removed, we recommend requesting removal directly through your county’s website.
| Date | Status | Borrower | Loan Amount |
|---|---|---|---|
| Open | $73,625 |
Tax History
We collect this data history from publicly available records. To have your information removed, we recommend requesting removal directly through your county’s website.
| Year | Tax Paid | Tax Assessment Tax Assessment Total Assessment is a certain percentage of the fair market value that is determined by local assessors to be the total taxable value of land and additions on the property. | Land | Improvement |
|---|---|---|---|---|
| 2025 | $244 | $0 | $0 | $0 |
| 2024 | $244 | $6,373 | $3,036 | $3,337 |
| 2023 | $422 | $4,109 | $1,018 | $3,091 |
| 2021 | $379 | $4,474 | $1,026 | $3,448 |
| 2020 | $327 | $4,474 | $1,026 | $3,448 |
| 2019 | $315 | $4,474 | $1,026 | $3,448 |
| 2018 | $280 | $3,574 | $886 | $2,688 |
| 2017 | $273 | $3,574 | $886 | $2,688 |
| 2016 | -- | $3,574 | $886 | $2,688 |
| 2015 | $270 | $3,574 | $886 | $2,688 |
| 2014 | $243 | $3,574 | $886 | $2,688 |
Map
- 1527 Racepath St
- 1105 Highway 15
- 1500 Highway 15 Unit Lot 38
- 1500 Highway 15
- 1500 Highway 15 Unit Lot 15
- 966 Periwinkle Place
- 1613 Stuart Square Cir
- 1719 Low Country Place Unit B
- 128 Hoffman Park Dr Unit 3
- 978 Periwinkle Place
- 1660 Stuart Square Cir
- 1043 Penny Ln
- 1782 Low Country Place Unit D
- 1208 Pinegrove Dr Unit G
- 1208 Pinegrove Dr Unit H
- 1129 9th Ave S
- 1065 Pinwheel Loop
- TBD Highway 15
- 1207 Pinegrove Dr Unit C
- 1207 Pinegrove Dr Unit B
- 635 Moore St Unit MB
- 651 Moore St
- 652 Martin St
- 644 Martin St
- 662 Martin St
- 627 Moore St
- 638 Moore St
- 646 Moore St
- 1162 Pine Island Rd
- 630 Moore St
- 1154 Pine Island Rd
- 636 Martin St
- 606 Martin St
- 1148 Pine Island Rd
- 1174 Pine Island Rd
- 622 Moore St Unit MB
- 1182 Pine Island Rd
- 657 Martin St
- 649 Martin St
- 629 King Dr
Ask me questions while you tour the home.