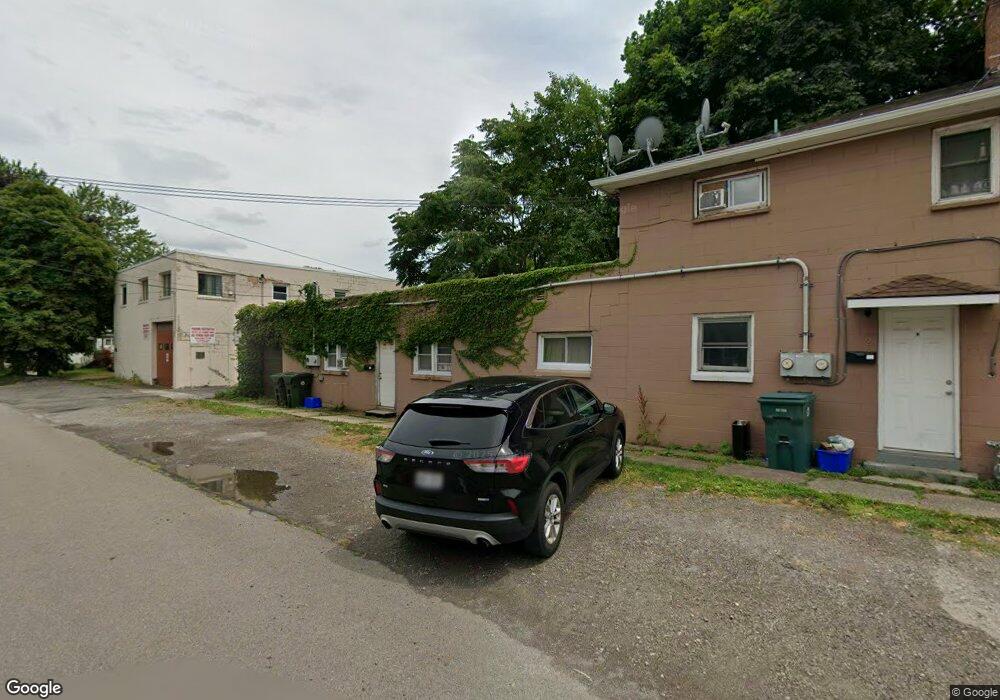
643 Oliver St North Tonawanda, NY 14120
Estimated Value: $121,000 - $195,925
9
Beds
3
Baths
3,248
Sq Ft
$51/Sq Ft
Est. Value
About This Home
This home is located at 643 Oliver St, North Tonawanda, NY 14120 and is currently estimated at $165,481, approximately $50 per square foot. 643 Oliver St is a home located in Niagara County with nearby schools including North Tonawanda Intermediate School and St Matthew Lutheran School.
Ownership History
Date
Name
Owned For
Owner Type
Purchase Details
Closed on
Sep 25, 2013
Sold by
Truty Daryl
Bought by
Bush Todd W
Current Estimated Value
Home Financials for this Owner
Home Financials are based on the most recent Mortgage that was taken out on this home.
Original Mortgage
$58,100
Outstanding Balance
$43,522
Interest Rate
4.42%
Mortgage Type
New Conventional
Estimated Equity
$121,959
Purchase Details
Closed on
Mar 4, 2010
Sold by
Newell David John
Bought by
Truty Daryl
Purchase Details
Closed on
Apr 28, 2000
Sold by
Newell Jack
Bought by
Newell David
Create a Home Valuation Report for This Property
The Home Valuation Report is an in-depth analysis detailing your home's value as well as a comparison with similar homes in the area
Home Values in the Area
Average Home Value in this Area
Purchase History
| Date | Buyer | Sale Price | Title Company |
|---|---|---|---|
| Bush Todd W | $83,000 | None Available | |
| Truty Daryl | $49,000 | None Available | |
| Newell David | -- | -- |
Source: Public Records
Mortgage History
| Date | Status | Borrower | Loan Amount |
|---|---|---|---|
| Open | Bush Todd W | $58,100 |
Source: Public Records
Tax History Compared to Growth
Tax History
| Year | Tax Paid | Tax Assessment Tax Assessment Total Assessment is a certain percentage of the fair market value that is determined by local assessors to be the total taxable value of land and additions on the property. | Land | Improvement |
|---|---|---|---|---|
| 2024 | $2,648 | $75,000 | $9,600 | $65,400 |
| 2023 | $2,582 | $75,000 | $9,600 | $65,400 |
| 2022 | $2,554 | $75,000 | $9,600 | $65,400 |
| 2021 | $2,537 | $75,000 | $9,600 | $65,400 |
| 2020 | $2,484 | $75,000 | $9,600 | $65,400 |
| 2019 | $1,028 | $75,000 | $9,600 | $65,400 |
| 2018 | $2,475 | $75,000 | $9,600 | $65,400 |
| 2017 | $2,438 | $75,000 | $9,600 | $65,400 |
| 2016 | $2,395 | $75,000 | $9,600 | $65,400 |
| 2015 | -- | $75,000 | $9,600 | $65,400 |
| 2014 | -- | $75,000 | $9,600 | $65,400 |
Source: Public Records
Map
Nearby Homes