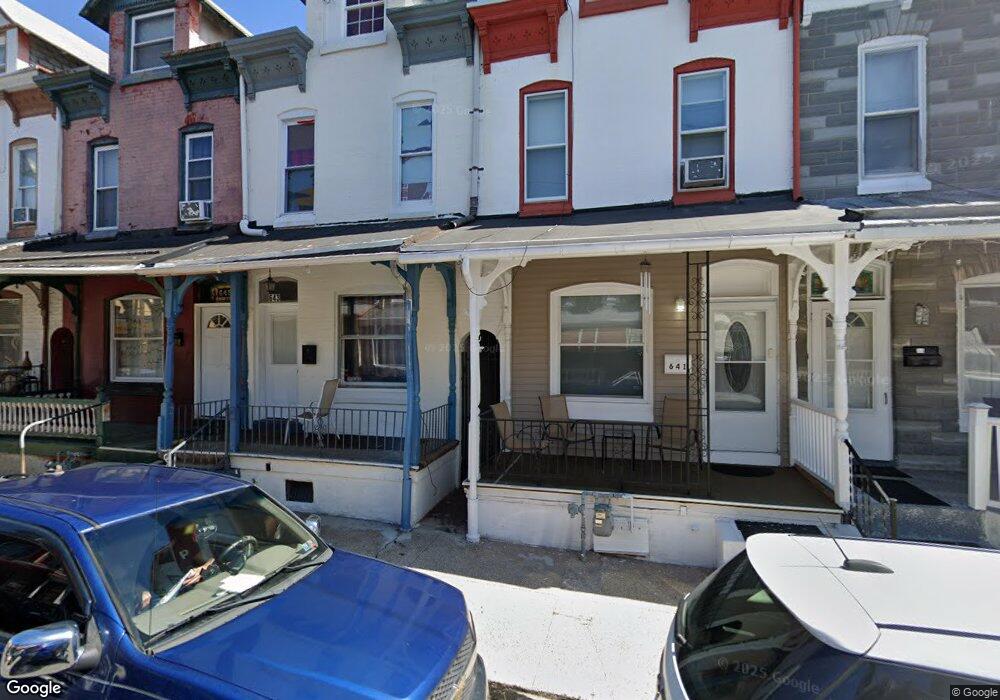
643 Pear St Reading, PA 19601
Estimated Value: $101,654 - $141,000
2
Beds
1
Bath
1,026
Sq Ft
$116/Sq Ft
Est. Value
About This Home
This home is located at 643 Pear St, Reading, PA 19601 and is currently estimated at $118,664, approximately $115 per square foot. 643 Pear St is a home located in Berks County with nearby schools including Riverside Elementary School, Central Middle School, and Reading Senior High School.
Ownership History
Date
Name
Owned For
Owner Type
Purchase Details
Closed on
Sep 25, 2021
Sold by
Ramirez Luis F Monterroso
Bought by
Ramirez Ana M Monterroso
Current Estimated Value
Purchase Details
Closed on
Dec 5, 2019
Sold by
Ortiz Leida J
Bought by
Ramirez Luis F Monterroso
Purchase Details
Closed on
Nov 25, 2009
Sold by
Ortiz Efrain
Bought by
Ortiz Leida J
Purchase Details
Closed on
Oct 31, 2008
Sold by
Levengood Lois and Davis Elsbeth M
Bought by
Ortiz Efrain
Create a Home Valuation Report for This Property
The Home Valuation Report is an in-depth analysis detailing your home's value as well as a comparison with similar homes in the area
Home Values in the Area
Average Home Value in this Area
Purchase History
| Date | Buyer | Sale Price | Title Company |
|---|---|---|---|
| Ramirez Ana M Monterroso | -- | None Available | |
| Ramirez Luis F Monterroso | $30,000 | Stewart Abstract | |
| Ortiz Leida J | $29,000 | Conestoga Title Insurance Co | |
| Ortiz Efrain | $23,000 | None Available |
Source: Public Records
Tax History Compared to Growth
Tax History
| Year | Tax Paid | Tax Assessment Tax Assessment Total Assessment is a certain percentage of the fair market value that is determined by local assessors to be the total taxable value of land and additions on the property. | Land | Improvement |
|---|---|---|---|---|
| 2025 | $719 | $26,500 | $6,100 | $20,400 |
| 2024 | $1,177 | $26,500 | $6,100 | $20,400 |
| 2023 | $1,158 | $26,500 | $6,100 | $20,400 |
| 2022 | $1,158 | $26,500 | $6,100 | $20,400 |
| 2021 | $1,158 | $26,500 | $6,100 | $20,400 |
| 2020 | $1,147 | $26,500 | $6,100 | $20,400 |
| 2019 | $1,147 | $26,500 | $6,100 | $20,400 |
| 2018 | $1,147 | $26,500 | $6,100 | $20,400 |
| 2017 | $1,139 | $26,500 | $6,100 | $20,400 |
| 2016 | $651 | $26,500 | $6,100 | $20,400 |
| 2015 | $651 | $26,500 | $6,100 | $20,400 |
| 2014 | $599 | $26,500 | $6,100 | $20,400 |
Source: Public Records
Map
Nearby Homes