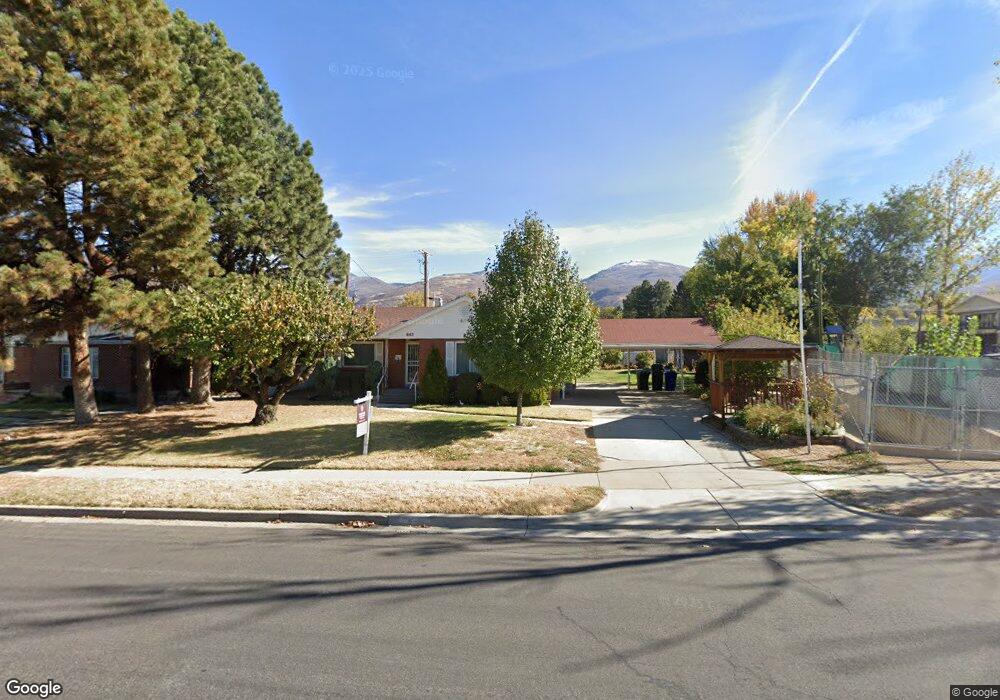
643 S 100 E Bountiful, UT 84010
Estimated Value: $467,000 - $521,983
4
Beds
2
Baths
2,056
Sq Ft
$240/Sq Ft
Est. Value
About This Home
This home is located at 643 S 100 E, Bountiful, UT 84010 and is currently estimated at $493,246, approximately $239 per square foot. 643 S 100 E is a home located in Davis County with nearby schools including Bountiful Elementary School, Millcreek Junior High School, and Bountiful High School.
Ownership History
Date
Name
Owned For
Owner Type
Purchase Details
Closed on
Nov 16, 2016
Sold by
Fenn Family Trust
Bought by
Williams Dallin and Bareno Angie
Current Estimated Value
Home Financials for this Owner
Home Financials are based on the most recent Mortgage that was taken out on this home.
Original Mortgage
$375,750
Interest Rate
6.49%
Mortgage Type
New Conventional
Purchase Details
Closed on
May 15, 1998
Sold by
Fenn Myrlin D and Fenn Marva D
Bought by
Fenn Marva D and Fenn Myrlin D
Create a Home Valuation Report for This Property
The Home Valuation Report is an in-depth analysis detailing your home's value as well as a comparison with similar homes in the area
Purchase History
| Date | Buyer | Sale Price | Title Company |
|---|---|---|---|
| Williams Dallin | -- | -- | |
| Fenn Myrlin D | -- | None Available | |
| Fenn Marva D | -- | -- |
Source: Public Records
Mortgage History
| Date | Status | Borrower | Loan Amount |
|---|---|---|---|
| Previous Owner | Williams Dallin | $375,750 |
Source: Public Records
Tax History
| Year | Tax Paid | Tax Assessment Tax Assessment Total Assessment is a certain percentage of the fair market value that is determined by local assessors to be the total taxable value of land and additions on the property. | Land | Improvement |
|---|---|---|---|---|
| 2025 | $2,971 | $244,750 | $148,286 | $96,464 |
| 2024 | $2,870 | $237,050 | $138,889 | $98,161 |
| 2023 | $2,764 | $413,000 | $250,406 | $162,594 |
| 2022 | $2,450 | $222,750 | $135,379 | $87,371 |
| 2021 | $2,252 | $314,000 | $177,389 | $136,611 |
| 2020 | $2,026 | $278,000 | $149,581 | $128,419 |
| 2019 | $2,036 | $273,000 | $145,334 | $127,666 |
| 2018 | $1,903 | $250,000 | $142,185 | $107,815 |
| 2016 | $1,576 | $111,430 | $62,678 | $48,752 |
| 2015 | $1,554 | $103,675 | $62,678 | $40,997 |
| 2014 | $1,423 | $97,212 | $62,678 | $34,534 |
| 2013 | -- | $90,750 | $38,848 | $51,902 |
Source: Public Records
Map
Nearby Homes
- 545 S 100 E
- 650 S Main St Unit 9106
- 275 E Peach Ln S
- 337 Peach Ln
- 323 Peach Ln
- 109 W 900 S
- 34 W 400 S
- 32 W 400 S
- 520 S Orchard Dr Unit 17
- 380 E 1500 S
- 1350 S 200 W
- 360 W 800 S
- 141 E 1650 S
- 1314 S 200 W Unit 19
- 1016 S 400 W
- 288 E 1650 S
- 55 E 200 N Unit 2
- 51 E 200 N Unit 3
- 49 E 200 N Unit 4
- 41 E 200 N Unit 6
Your Personal Tour Guide
Ask me questions while you tour the home.