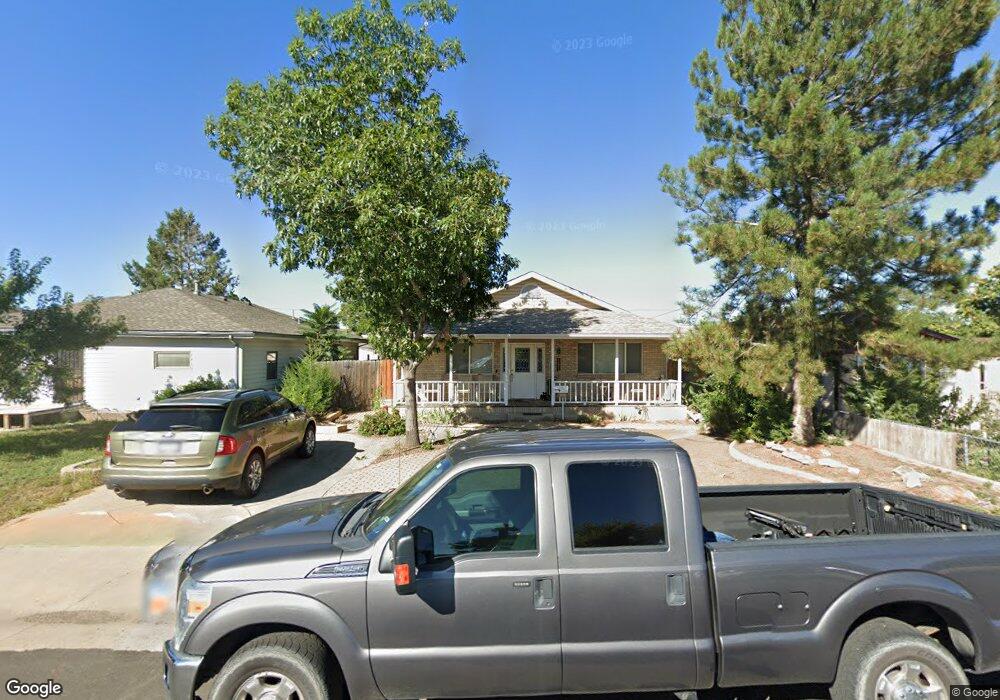
643 S 5th Ave Brighton, CO 80601
Estimated Value: $416,000 - $472,000
3
Beds
2
Baths
1,800
Sq Ft
$247/Sq Ft
Est. Value
About This Home
This home is located at 643 S 5th Ave, Brighton, CO 80601 and is currently estimated at $444,877, approximately $247 per square foot. 643 S 5th Ave is a home located in Adams County with nearby schools including South Elementary School, Vikan Middle School, and Brighton High School.
Ownership History
Date
Name
Owned For
Owner Type
Purchase Details
Closed on
May 3, 2002
Sold by
Lohmann Karen K
Bought by
Ewing Bruce L and Ewing Debbie L
Current Estimated Value
Home Financials for this Owner
Home Financials are based on the most recent Mortgage that was taken out on this home.
Original Mortgage
$150,000
Outstanding Balance
$61,951
Interest Rate
7.19%
Estimated Equity
$382,926
Purchase Details
Closed on
Mar 23, 1995
Sold by
Tenorio Frank E
Bought by
Lohmann Karen K
Purchase Details
Closed on
Jul 9, 1993
Create a Home Valuation Report for This Property
The Home Valuation Report is an in-depth analysis detailing your home's value as well as a comparison with similar homes in the area
Home Values in the Area
Average Home Value in this Area
Purchase History
| Date | Buyer | Sale Price | Title Company |
|---|---|---|---|
| Ewing Bruce L | $225,000 | Land Title | |
| Lohmann Karen K | -- | -- | |
| -- | $14,500 | -- |
Source: Public Records
Mortgage History
| Date | Status | Borrower | Loan Amount |
|---|---|---|---|
| Open | Ewing Bruce L | $150,000 |
Source: Public Records
Tax History
| Year | Tax Paid | Tax Assessment Tax Assessment Total Assessment is a certain percentage of the fair market value that is determined by local assessors to be the total taxable value of land and additions on the property. | Land | Improvement |
|---|---|---|---|---|
| 2025 | $2,372 | $29,720 | $5,780 | $23,940 |
| 2024 | $2,372 | $27,310 | $5,310 | $22,000 |
| 2023 | $2,361 | $31,930 | $5,410 | $26,520 |
| 2022 | $2,158 | $26,600 | $4,930 | $21,670 |
| 2021 | $2,024 | $26,600 | $4,930 | $21,670 |
| 2020 | $1,823 | $25,610 | $4,860 | $20,750 |
| 2019 | $2,531 | $25,610 | $4,860 | $20,750 |
| 2018 | $1,894 | $19,150 | $4,750 | $14,400 |
| 2017 | $1,891 | $19,150 | $4,750 | $14,400 |
| 2016 | $1,857 | $18,740 | $2,390 | $16,350 |
| 2015 | $1,853 | $18,740 | $2,390 | $16,350 |
| 2014 | -- | $13,110 | $1,910 | $11,200 |
Source: Public Records
Map
Nearby Homes
- 617 S 5th Ave
- 648 S 3rd Ave
- 475 S 2nd Ave
- 475 S 2nd Ave Unit Plot 1
- 765 S 1st Ave
- 865 S 8th Ave
- 835 S 9th Ave
- 141 E Bromley Ln
- 303 S 2nd Ave
- 285 S 8th Ave
- 219 S 3rd Ave
- 792 S 12th Ave
- 204 E Egbert St
- 135 S 3rd Ave
- 113 S 4th Ave
- 107 S 4th Ave
- 175 S 10th Ave
- 230 Ash Ave Unit 4
- 126 S 9th Ave
- 362 Dogwood Ave
Your Personal Tour Guide
Ask me questions while you tour the home.