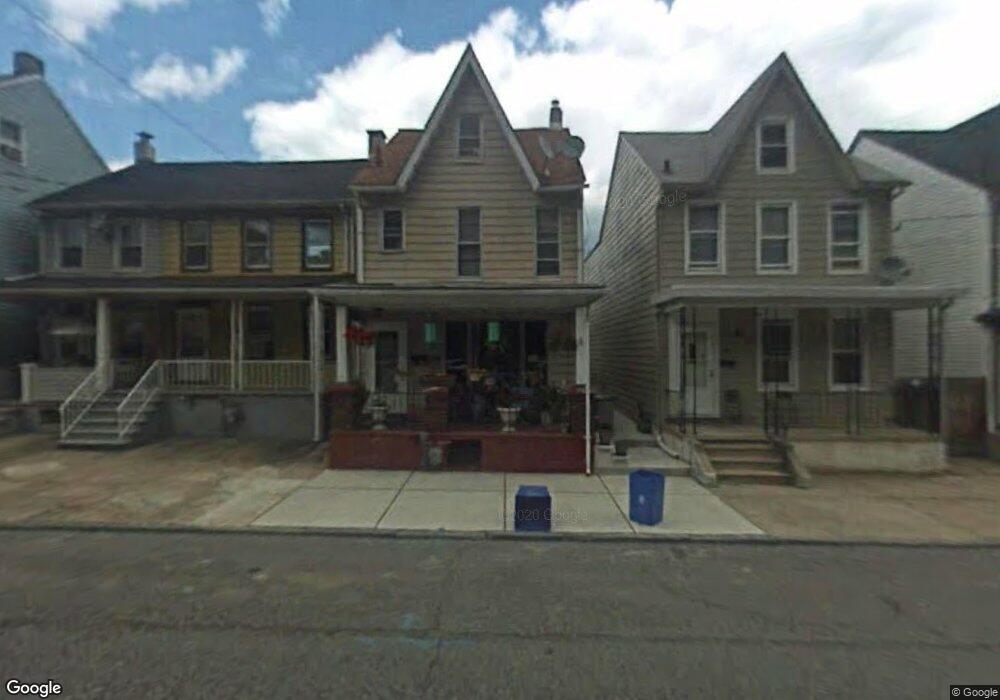
643 S Main St Phillipsburg, NJ 08865
Estimated Value: $155,000 - $242,000
--
Bed
--
Bath
1,220
Sq Ft
$154/Sq Ft
Est. Value
About This Home
This home is located at 643 S Main St, Phillipsburg, NJ 08865 and is currently estimated at $188,413, approximately $154 per square foot. 643 S Main St is a home located in Warren County with nearby schools including Phillipsburg High School, Easton Arts Academy Elementary Cs, and Sts. Philip & James School.
Ownership History
Date
Name
Owned For
Owner Type
Purchase Details
Closed on
Jan 30, 2009
Sold by
Slamon Sheryl A
Bought by
Slamon Sheryl A and Westbrook Farley Charles
Current Estimated Value
Home Financials for this Owner
Home Financials are based on the most recent Mortgage that was taken out on this home.
Original Mortgage
$157,366
Outstanding Balance
$100,270
Interest Rate
5.25%
Mortgage Type
New Conventional
Estimated Equity
$88,143
Purchase Details
Closed on
Jun 13, 2000
Sold by
Warne Gladys P
Bought by
Slamon Sheryl A
Home Financials for this Owner
Home Financials are based on the most recent Mortgage that was taken out on this home.
Original Mortgage
$46,800
Interest Rate
8.28%
Create a Home Valuation Report for This Property
The Home Valuation Report is an in-depth analysis detailing your home's value as well as a comparison with similar homes in the area
Home Values in the Area
Average Home Value in this Area
Purchase History
| Date | Buyer | Sale Price | Title Company |
|---|---|---|---|
| Slamon Sheryl A | -- | Sunrise Title Services Inc | |
| Slamon Sheryl A | $52,000 | -- |
Source: Public Records
Mortgage History
| Date | Status | Borrower | Loan Amount |
|---|---|---|---|
| Open | Slamon Sheryl A | $157,366 | |
| Closed | Slamon Sheryl A | $46,800 |
Source: Public Records
Tax History Compared to Growth
Tax History
| Year | Tax Paid | Tax Assessment Tax Assessment Total Assessment is a certain percentage of the fair market value that is determined by local assessors to be the total taxable value of land and additions on the property. | Land | Improvement |
|---|---|---|---|---|
| 2025 | $3,059 | $67,300 | $12,000 | $55,300 |
| 2024 | $2,824 | $67,300 | $12,000 | $55,300 |
| 2023 | $2,792 | $67,300 | $12,000 | $55,300 |
| 2022 | $2,792 | $67,300 | $12,000 | $55,300 |
| 2021 | $2,702 | $67,300 | $12,000 | $55,300 |
| 2020 | $2,720 | $67,300 | $12,000 | $55,300 |
| 2019 | $2,679 | $67,300 | $12,000 | $55,300 |
| 2018 | $2,679 | $67,300 | $12,000 | $55,300 |
| 2017 | $2,667 | $67,300 | $12,000 | $55,300 |
| 2016 | $2,626 | $67,300 | $12,000 | $55,300 |
| 2015 | $2,606 | $67,300 | $12,000 | $55,300 |
| 2014 | $2,521 | $67,300 | $12,000 | $55,300 |
Source: Public Records
Map
Nearby Homes