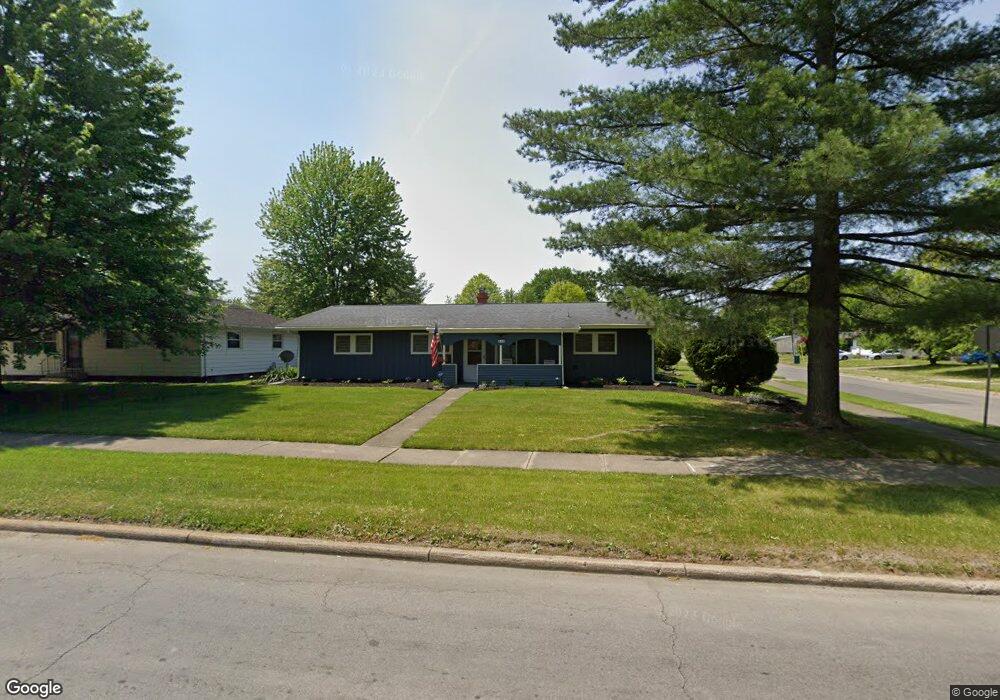
643 Southern Blvd NW Warren, OH 44485
Austin Village NeighborhoodEstimated Value: $95,000 - $120,000
3
Beds
2
Baths
1,568
Sq Ft
$68/Sq Ft
Est. Value
About This Home
This home is located at 643 Southern Blvd NW, Warren, OH 44485 and is currently estimated at $106,153, approximately $67 per square foot. 643 Southern Blvd NW is a home located in Trumbull County with nearby schools including McGuffey School, Warren G. Harding High School, and Summit Academy Warren Middle & Secondary.
Ownership History
Date
Name
Owned For
Owner Type
Purchase Details
Closed on
Nov 8, 2005
Sold by
Harris Felecia Joi and Marilla Sylvesta Jo Ann
Bought by
Harris Felecia Joi and Marilla Sylvesta Jo Ann
Current Estimated Value
Purchase Details
Closed on
Nov 7, 2005
Sold by
Harris Felecia Joi and Marilla Sylvesta Jo Ann
Bought by
Harris Felecia Joi and Marilla Sylvesta Jo Ann
Purchase Details
Closed on
May 15, 2003
Sold by
Harris Felecia Joi
Bought by
Marilla Sylvesta Jo Ann
Purchase Details
Closed on
Mar 19, 2003
Sold by
Mccoy Felecia Joi and Marilla Sylvesta Jo Ann
Bought by
Harris Felecia Joi
Purchase Details
Closed on
Mar 7, 2001
Sold by
Mccoy Felecia Joi and Mccoy Felicia Joi
Bought by
Mccoy Felecia Joi and Marilla Sylvesta Jo Ann
Purchase Details
Closed on
Oct 9, 1998
Sold by
Marilla Sylvesta Jo Ann
Bought by
Mccoy Felicia Joi
Home Financials for this Owner
Home Financials are based on the most recent Mortgage that was taken out on this home.
Original Mortgage
$44,880
Interest Rate
6.97%
Purchase Details
Closed on
Jan 1, 1990
Bought by
Sylvesta Jo Ann
Create a Home Valuation Report for This Property
The Home Valuation Report is an in-depth analysis detailing your home's value as well as a comparison with similar homes in the area
Home Values in the Area
Average Home Value in this Area
Purchase History
| Date | Buyer | Sale Price | Title Company |
|---|---|---|---|
| Harris Felecia Joi | -- | -- | |
| Harris Felecia Joi | -- | -- | |
| Marilla Sylvesta Jo Ann | -- | -- | |
| Harris Felecia Joi | -- | -- | |
| Mccoy Felecia Joi | -- | -- | |
| Mccoy Felicia Joi | $44,000 | -- | |
| Sylvesta Jo Ann | -- | -- |
Source: Public Records
Mortgage History
| Date | Status | Borrower | Loan Amount |
|---|---|---|---|
| Previous Owner | Mccoy Felicia Joi | $44,880 |
Source: Public Records
Tax History Compared to Growth
Tax History
| Year | Tax Paid | Tax Assessment Tax Assessment Total Assessment is a certain percentage of the fair market value that is determined by local assessors to be the total taxable value of land and additions on the property. | Land | Improvement |
|---|---|---|---|---|
| 2024 | $216 | $23,980 | $2,940 | $21,040 |
| 2023 | $216 | $23,980 | $2,940 | $21,040 |
| 2022 | $0 | $14,280 | $2,940 | $11,340 |
| 2021 | $349 | $14,280 | $2,940 | $11,340 |
| 2020 | $350 | $14,280 | $2,940 | $11,340 |
| 2019 | $334 | $13,760 | $2,940 | $10,820 |
| 2018 | $332 | $13,760 | $2,940 | $10,820 |
| 2017 | $327 | $13,760 | $2,940 | $10,820 |
| 2016 | $576 | $17,890 | $3,920 | $13,970 |
| 2015 | $573 | $17,890 | $3,920 | $13,970 |
| 2014 | $570 | $17,890 | $3,920 | $13,970 |
| 2013 | $801 | $22,300 | $3,920 | $18,380 |
Source: Public Records
Map
Nearby Homes
- 2931 Randolph St NW
- 2879 Linda Dr NW
- 2144 Northwest Blvd NW
- 1647 Southern Blvd NW
- 1727 Lexington Ave NW
- 1552 Denison Ave NW
- 1945 Norwood St NW
- 1936 Norwood St NW
- 1166 Raymond St NW
- 666 Dickey Ave NW
- 589 Briggs Rd
- 358 Burwell Rd
- 1325 Moncrest Dr NW
- 1056 Orlo Dr NW
- 806 Parkman Rd NW
- 983 Garden St NW
- 3000 Parkman Rd NW
- 600 Parkman Rd NW
- 1351 Bradford St NW
- 1331 Bradford St NW
- 631 Southern Blvd NW
- 2733 Randolph St NW
- 619 Southern Blvd NW
- 2747 Randolph St NW
- 2734 Randolph St NW
- 605 Southern Blvd NW
- 644 Southern Blvd NW
- 654 Southern Blvd NW
- 725 Southern Blvd NW
- 632 Southern Blvd NW
- 2759 Randolph St NW
- 704 Southern Blvd NW
- 2748 Randolph St NW
- 620 Southern Blvd NW
- 716 Southern Blvd NW
- 608 Southern Blvd NW
- 2760 Randolph St NW
- 2771 Randolph St NW
- 741 Southern Blvd NW
- 728 Southern Blvd NW