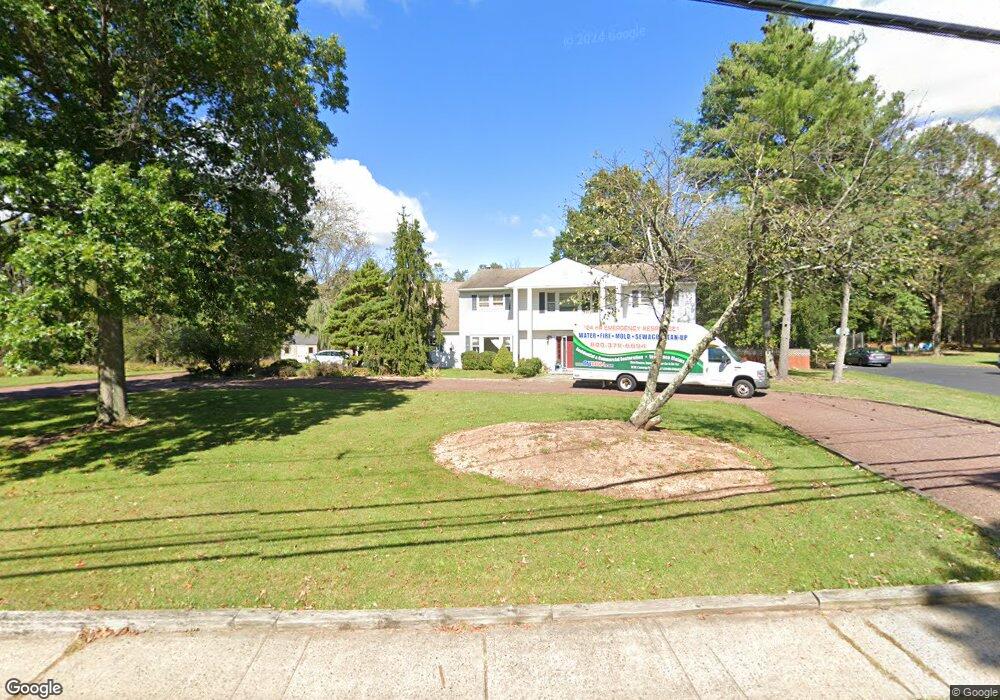
643 Talamini Rd Bridgewater, NJ 08807
Estimated Value: $872,365 - $935,000
--
Bed
--
Bath
2,728
Sq Ft
$333/Sq Ft
Est. Value
About This Home
This home is located at 643 Talamini Rd, Bridgewater, NJ 08807 and is currently estimated at $907,591, approximately $332 per square foot. 643 Talamini Rd is a home located in Somerset County with nearby schools including Van Holten Primary School, Eisenhower Intermediate School, and Bridgewater-Raritan Middle School.
Ownership History
Date
Name
Owned For
Owner Type
Purchase Details
Closed on
May 27, 2010
Sold by
Major Ken L and Rahn Ann
Bought by
Howell William G and Howell Mayra L
Current Estimated Value
Home Financials for this Owner
Home Financials are based on the most recent Mortgage that was taken out on this home.
Original Mortgage
$360,000
Outstanding Balance
$243,159
Interest Rate
5.13%
Mortgage Type
New Conventional
Estimated Equity
$664,432
Purchase Details
Closed on
Jan 31, 2002
Sold by
Shiman Gary
Bought by
Major Ken and Rahn Ann
Home Financials for this Owner
Home Financials are based on the most recent Mortgage that was taken out on this home.
Original Mortgage
$286,000
Interest Rate
7.13%
Mortgage Type
Purchase Money Mortgage
Purchase Details
Closed on
Feb 25, 1994
Sold by
Moreno Est Bette
Bought by
Shiman Gary and Shiman Jill
Home Financials for this Owner
Home Financials are based on the most recent Mortgage that was taken out on this home.
Original Mortgage
$207,000
Interest Rate
6.93%
Create a Home Valuation Report for This Property
The Home Valuation Report is an in-depth analysis detailing your home's value as well as a comparison with similar homes in the area
Home Values in the Area
Average Home Value in this Area
Purchase History
| Date | Buyer | Sale Price | Title Company |
|---|---|---|---|
| Howell William G | $530,000 | None Available | |
| Major Ken | $445,500 | -- | |
| Shiman Gary | $259,000 | -- |
Source: Public Records
Mortgage History
| Date | Status | Borrower | Loan Amount |
|---|---|---|---|
| Open | Howell William G | $360,000 | |
| Previous Owner | Major Ken | $286,000 | |
| Previous Owner | Shiman Gary | $207,000 |
Source: Public Records
Tax History Compared to Growth
Tax History
| Year | Tax Paid | Tax Assessment Tax Assessment Total Assessment is a certain percentage of the fair market value that is determined by local assessors to be the total taxable value of land and additions on the property. | Land | Improvement |
|---|---|---|---|---|
| 2025 | $13,386 | $692,800 | $270,600 | $422,200 |
| 2024 | $13,386 | $686,100 | $270,600 | $415,500 |
| 2023 | $12,486 | $629,000 | $270,600 | $358,400 |
| 2022 | $11,811 | $575,300 | $266,100 | $309,200 |
| 2021 | $11,584 | $557,500 | $266,100 | $291,400 |
| 2020 | $11,592 | $553,600 | $266,100 | $287,500 |
| 2019 | $11,584 | $547,700 | $266,100 | $281,600 |
| 2018 | $11,419 | $541,200 | $266,100 | $275,100 |
| 2017 | $11,346 | $537,200 | $266,100 | $271,100 |
| 2016 | $11,160 | $536,300 | $266,100 | $270,200 |
| 2015 | $11,051 | $531,300 | $266,100 | $265,200 |
| 2014 | $10,735 | $508,300 | $266,100 | $242,200 |
Source: Public Records
Map
Nearby Homes
- 730 Wingate Dr
- 737 Wingate Dr
- 795 Dow Rd
- 698 Foothill Rd
- 2 Presidents Dr
- 840 Dow Rd
- 700 Half Foothill Rd
- 235 Candlewick Ln
- 42 Stryker Ct
- 93 Highland Ave
- 11 Ash St
- 265 Riverview Dr
- 20 Copper Hill Rd
- 61 Stella Dr
- 596 Meadow Rd
- 421 Country Club Rd
- 684 N View Dr
- 800 Star View Way
- 356 Greenfield Rd
- 731 Cedarbrook Rd
- 649 Talamini Rd
- 655 Talamini Rd
- 628 Strawbridge St
- 632 Strawbridge St
- 675 Red Lion Way
- 681 Red Lion Way
- 624 Strawbridge St
- 663 Glen Ridge Dr
- 685 Red Lion Way
- 625 Talamini Rd
- 652 Glen Ridge Dr
- 636 Strawbridge St
- 627 Strawbridge St
- 691 Red Lion Way
- 624 Talamini Rd
- 617 Talamini Rd
- 648 Glen Ridge Dr
- 616 Strawbridge St
- 674 Red Lion Way
- 621 Strawbridge St