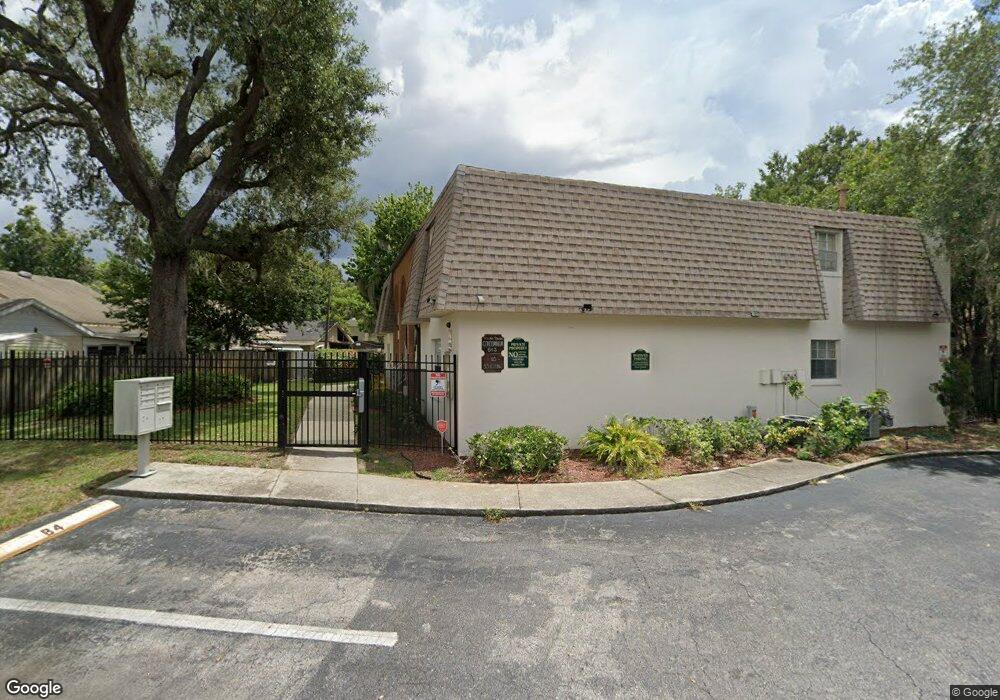
643 W Oak Terrace Dr Unit A4 Leesburg, FL 34748
Estimated Value: $93,000 - $147,000
2
Beds
2
Baths
1,089
Sq Ft
$105/Sq Ft
Est. Value
About This Home
This home is located at 643 W Oak Terrace Dr Unit A4, Leesburg, FL 34748 and is currently estimated at $114,068, approximately $104 per square foot. 643 W Oak Terrace Dr Unit A4 is a home located in Lake County with nearby schools including Beverly Shores Elementary School, Carver Middle School, and Leesburg High School.
Ownership History
Date
Name
Owned For
Owner Type
Purchase Details
Closed on
Jun 28, 2017
Sold by
Rlw Holdings Llc
Bought by
Barros Frederico Rodrigues and Barros Eduardo Rodrigues
Current Estimated Value
Purchase Details
Closed on
Nov 21, 2013
Sold by
Fillman Jack and Fillman Patricia
Bought by
Rlw Holdings Llc
Purchase Details
Closed on
Feb 1, 2011
Sold by
Mcconnell R Patton and Mcconnell Gail S
Bought by
Fillman Jack and Fillman Patricia
Home Financials for this Owner
Home Financials are based on the most recent Mortgage that was taken out on this home.
Original Mortgage
$31,000
Interest Rate
4.82%
Mortgage Type
Seller Take Back
Purchase Details
Closed on
Aug 29, 2003
Sold by
Louder Robert J
Bought by
Mcconnell R Patton and Mcconnell Gail S
Purchase Details
Closed on
Nov 6, 1997
Sold by
Beasley Carlos O and Beasley Nell S
Bought by
Bealey Carlos O
Create a Home Valuation Report for This Property
The Home Valuation Report is an in-depth analysis detailing your home's value as well as a comparison with similar homes in the area
Home Values in the Area
Average Home Value in this Area
Purchase History
| Date | Buyer | Sale Price | Title Company |
|---|---|---|---|
| Barros Frederico Rodrigues | $40,000 | Attorney | |
| Rlw Holdings Llc | $30,000 | Attorney | |
| Fillman Jack | $35,000 | Attorney | |
| Mcconnell R Patton | $53,000 | -- | |
| Bealey Carlos O | -- | -- |
Source: Public Records
Mortgage History
| Date | Status | Borrower | Loan Amount |
|---|---|---|---|
| Previous Owner | Fillman Jack | $31,000 |
Source: Public Records
Tax History Compared to Growth
Tax History
| Year | Tax Paid | Tax Assessment Tax Assessment Total Assessment is a certain percentage of the fair market value that is determined by local assessors to be the total taxable value of land and additions on the property. | Land | Improvement |
|---|---|---|---|---|
| 2025 | $920 | $56,608 | $13,420 | $43,188 |
| 2024 | $920 | $52,100 | $8,912 | $43,188 |
| 2023 | $920 | $49,412 | $8,912 | $40,500 |
| 2022 | $842 | $49,412 | $8,912 | $40,500 |
| 2021 | $728 | $38,261 | $0 | $0 |
| 2020 | $771 | $38,261 | $0 | $0 |
| 2019 | $760 | $38,261 | $0 | $0 |
| 2018 | $749 | $38,261 | $0 | $0 |
| 2017 | $697 | $35,262 | $0 | $0 |
| 2016 | $708 | $35,262 | $0 | $0 |
| 2015 | $715 | $34,682 | $0 | $0 |
| 2014 | $654 | $34,155 | $0 | $0 |
Source: Public Records
Map
Nearby Homes
- 0 W Oak Terrace Dr
- 600 W Oak Terrace Dr
- 100 E Oak Terrace Dr Unit A2
- 505 Richard St
- 506 Perkins St
- 705 Perkins St Unit 100
- 915 Lee St
- 1109 Edmonds St
- 208 Lowe Rd
- 1001 Oak Dr
- 213 Rogers Rd
- 1120 Webster St
- 212 Lowe Rd
- 218 Lowe Rd
- 1105 Johnson St
- 1009 Perkins St
- 807 Bass St
- 815 Bass St
- 802 Bass St
- 600 Long Rd
- 643 W Oak Terrace Dr Unit 4A
- 643 W Oak Terrace Dr Unit 2B
- 643 W Oak Terrace Dr Unit B Village Square of
- 643 W Oak Terrace Dr
- 643 W Oak Terrace Dr Unit B1
- 643 W Oak Terrace Dr Unit A1
- 643 W Oak Terrace Dr Unit B4
- 643 W Oak Terrace Dr Unit B3
- 643 W Oak Terrace Dr Unit A3
- 643 W Oak Terrace Dr Unit B2
- 643 W Oak Terrace Dr Unit A2
- 643 W Oak Terrace Dr Unit 1
- 643 W Oak Terrace Dr Unit 1A
- 643 W Oak Terrace Dr Unit 3
- 643 W Oak Terrace Dr Unit 4
- 643 W Oak Terrace Dr Unit 1B
- 633 W Oak Terrace Dr
- 635 W Oak Terrace Dr
- 631 W Oak Terrace Dr