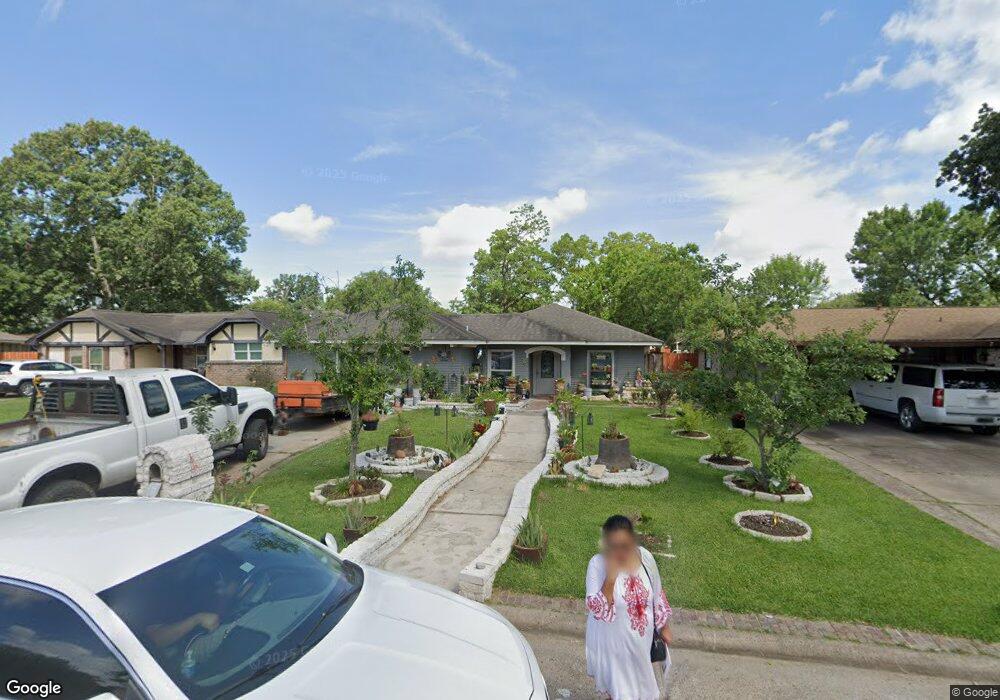
6430 Silver Chalice Dr Houston, TX 77088
Greater Inwood NeighborhoodEstimated Value: $208,000 - $251,000
3
Beds
2
Baths
1,661
Sq Ft
$137/Sq Ft
Est. Value
About This Home
This home is located at 6430 Silver Chalice Dr, Houston, TX 77088 and is currently estimated at $227,330, approximately $136 per square foot. 6430 Silver Chalice Dr is a home located in Harris County with nearby schools including Edward a Vines EC/Pre-K/K School, Ermel Elementary School, and Dr. Viola K. Garcia Middle School.
Ownership History
Date
Name
Owned For
Owner Type
Purchase Details
Closed on
Sep 16, 2004
Sold by
Silva Natanael and Duenas Esther
Bought by
Lopez Enrique C
Current Estimated Value
Home Financials for this Owner
Home Financials are based on the most recent Mortgage that was taken out on this home.
Original Mortgage
$86,450
Outstanding Balance
$42,772
Interest Rate
5.86%
Mortgage Type
Purchase Money Mortgage
Estimated Equity
$184,558
Purchase Details
Closed on
Mar 9, 2001
Sold by
Devilla Guillermo
Bought by
Silva Natanael
Home Financials for this Owner
Home Financials are based on the most recent Mortgage that was taken out on this home.
Original Mortgage
$76,500
Interest Rate
10.6%
Purchase Details
Closed on
Oct 27, 1999
Sold by
Fenton Elliott C and Fenton Nancy C
Bought by
Devilla Guillermo
Home Financials for this Owner
Home Financials are based on the most recent Mortgage that was taken out on this home.
Original Mortgage
$65,466
Interest Rate
7.85%
Mortgage Type
FHA
Create a Home Valuation Report for This Property
The Home Valuation Report is an in-depth analysis detailing your home's value as well as a comparison with similar homes in the area
Home Values in the Area
Average Home Value in this Area
Purchase History
| Date | Buyer | Sale Price | Title Company |
|---|---|---|---|
| Lopez Enrique C | -- | Stewart Title Houston Div | |
| Silva Natanael | -- | Texas American Title Company | |
| Devilla Guillermo | -- | Fidelity National Title |
Source: Public Records
Mortgage History
| Date | Status | Borrower | Loan Amount |
|---|---|---|---|
| Open | Lopez Enrique C | $86,450 | |
| Previous Owner | Silva Natanael | $76,500 | |
| Previous Owner | Devilla Guillermo | $65,466 |
Source: Public Records
Tax History Compared to Growth
Tax History
| Year | Tax Paid | Tax Assessment Tax Assessment Total Assessment is a certain percentage of the fair market value that is determined by local assessors to be the total taxable value of land and additions on the property. | Land | Improvement |
|---|---|---|---|---|
| 2025 | $2,643 | $214,616 | $51,291 | $163,325 |
| 2024 | $2,643 | $219,746 | $51,291 | $168,455 |
| 2023 | $2,643 | $207,079 | $51,291 | $155,788 |
| 2022 | $3,582 | $192,446 | $51,291 | $141,155 |
| 2021 | $3,410 | $153,384 | $16,335 | $137,049 |
| 2020 | $3,257 | $126,737 | $16,335 | $110,402 |
| 2019 | $3,104 | $121,624 | $12,414 | $109,210 |
| 2018 | $1,105 | $101,985 | $12,414 | $89,571 |
| 2017 | $2,575 | $101,985 | $12,414 | $89,571 |
| 2016 | $2,341 | $88,234 | $12,414 | $75,820 |
| 2015 | $1,821 | $88,234 | $12,414 | $75,820 |
| 2014 | $1,821 | $83,879 | $12,414 | $71,465 |
Source: Public Records
Map
Nearby Homes
- 6407 Deirdre Anne Dr
- 6338 Maple Hill Dr
- 6310 Silver Chalice Dr
- 6902 Anson Point Ln
- 8610 Twillingate Ln
- 6931 Wagonwheel Ln
- 6202 Wagonwheel Cir
- 7218 Jadewood Dr Unit 770
- 8615 Black Tern Ln
- 6430 Pirtlewood Cir
- 6918 Bent Branch Dr
- 7219 Ridge Oak Dr
- 7146 Bayou Forest Dr
- 6311 Fairwood Dr
- 7218 Stonegate Dr
- 7402 Alabonson Rd Unit 506
- 7402 Alabonson Rd Unit 309
- 7402 Alabonson Rd Unit 510
- 7402 Alabonson Rd Unit 108
- 7606 Victory Dr
- 6426 Silver Chalice Dr
- 6434 Silver Chalice Dr
- 6431 French Chateau Dr
- 6435 French Chateau Dr
- 6422 Silver Chalice Dr
- 6427 French Chateau Dr
- 6438 Silver Chalice Dr
- 6423 French Chateau Dr
- 6431 Silver Chalice Dr
- 6418 Silver Chalice Dr
- 6439 French Chateau Dr
- 6427 Silver Chalice Dr
- 6442 Silver Chalice Dr
- 6423 Silver Chalice Dr
- 6419 French Chateau Dr
- 6439 Silver Chalice Dr
- 6414 Silver Chalice Dr
- 6419 Silver Chalice Dr
- 6442 French Chateau Dr
- 6415 French Chateau Dr