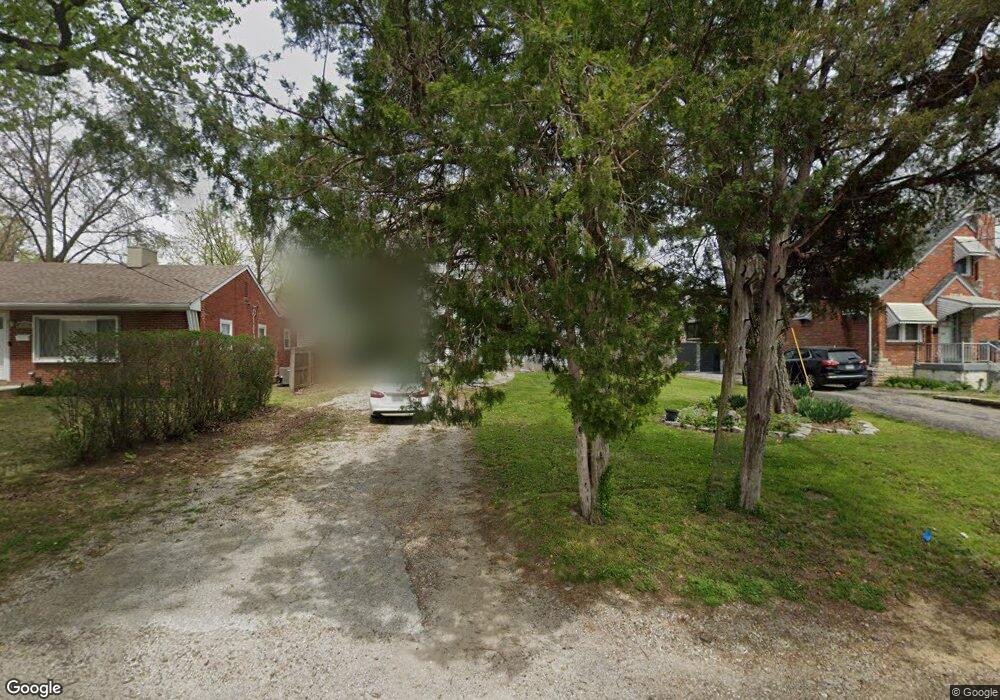
6431 Weber Rd Saint Louis, MO 63123
Estimated Value: $237,000 - $299,000
4
Beds
2
Baths
2,084
Sq Ft
$132/Sq Ft
Est. Value
About This Home
This home is located at 6431 Weber Rd, Saint Louis, MO 63123 and is currently estimated at $274,889, approximately $131 per square foot. 6431 Weber Rd is a home located in St. Louis County with nearby schools including Mesnier Primary School, Gotsch Intermediate School, and Rogers Middle School.
Ownership History
Date
Name
Owned For
Owner Type
Purchase Details
Closed on
Jun 15, 2018
Sold by
Crowley Matt
Bought by
Crowley Jon Matthew and Jon Matthew Crowley Revocable
Current Estimated Value
Purchase Details
Closed on
Sep 22, 2010
Sold by
Hermann Robert J
Bought by
Crowley Matt
Purchase Details
Closed on
Jan 13, 2008
Sold by
Herman Jennifer L
Bought by
Herman Robert J
Purchase Details
Closed on
Oct 8, 2002
Sold by
Herman Robert J and Herman Jennifer L
Bought by
Herman Robert J and Herman Jennifer L
Home Financials for this Owner
Home Financials are based on the most recent Mortgage that was taken out on this home.
Original Mortgage
$122,500
Interest Rate
6.09%
Purchase Details
Closed on
Aug 23, 1999
Sold by
Herman Robert and Herman Jennifer L
Bought by
Herman Robert J and Herman Jennifer L
Home Financials for this Owner
Home Financials are based on the most recent Mortgage that was taken out on this home.
Original Mortgage
$75,000
Interest Rate
8.36%
Create a Home Valuation Report for This Property
The Home Valuation Report is an in-depth analysis detailing your home's value as well as a comparison with similar homes in the area
Home Values in the Area
Average Home Value in this Area
Purchase History
| Date | Buyer | Sale Price | Title Company |
|---|---|---|---|
| Crowley Jon Matthew | -- | None Available | |
| Crowley Matt | $52,000 | Lenders Guarantee Title Co | |
| Herman Robert J | -- | None Available | |
| Herman Robert J | -- | -- | |
| Herman Robert J | -- | -- |
Source: Public Records
Mortgage History
| Date | Status | Borrower | Loan Amount |
|---|---|---|---|
| Previous Owner | Herman Robert J | $122,500 | |
| Previous Owner | Herman Robert J | $75,000 |
Source: Public Records
Tax History Compared to Growth
Tax History
| Year | Tax Paid | Tax Assessment Tax Assessment Total Assessment is a certain percentage of the fair market value that is determined by local assessors to be the total taxable value of land and additions on the property. | Land | Improvement |
|---|---|---|---|---|
| 2025 | $3,670 | $49,010 | $13,950 | $35,060 |
| 2024 | $3,670 | $45,260 | $9,290 | $35,970 |
| 2023 | $3,670 | $45,260 | $9,290 | $35,970 |
| 2022 | $3,366 | $36,780 | $9,290 | $27,490 |
| 2021 | $3,072 | $36,780 | $9,290 | $27,490 |
| 2020 | $2,723 | $30,380 | $8,930 | $21,450 |
| 2019 | $2,717 | $30,380 | $8,930 | $21,450 |
| 2018 | $2,058 | $20,270 | $6,210 | $14,060 |
| 2017 | $2,045 | $20,270 | $6,210 | $14,060 |
| 2016 | $1,978 | $20,850 | $3,650 | $17,200 |
| 2015 | $1,987 | $20,850 | $3,650 | $17,200 |
| 2014 | $2,719 | $28,520 | $5,930 | $22,590 |
Source: Public Records
Map
Nearby Homes
- 8554 Palmetto Dr
- 8740 Brenda Ave
- 8736 New Hampshire Ave
- 6426 Judson Ave
- 6236 Bixby Ave
- 9702 Sterling Place
- 8505 Ava Dr
- 6325 Sheppard Dr
- 8509 Mackenzie Rd
- 6211 Bixby Ave
- 9506 Sterling Place
- 8942 Eden Ave
- 9313 Brenda Ave
- 8613 Carriage Way Dr
- 8400 New Hampshire Ave
- 6540 Lawnside Dr
- 9347 Mackenzie Rd
- 9409 Alpine Dr
- 9127 Coral Dr
- 8348 Vasel Dr