K
Seller's Agent in 2026
Kent Illges
Coldwell Banker / Kennon, Parker, Duncan & Davis
(706) 256-1000
62 in this area
113 Total Sales

Estimated Value: $202,000 - $213,000
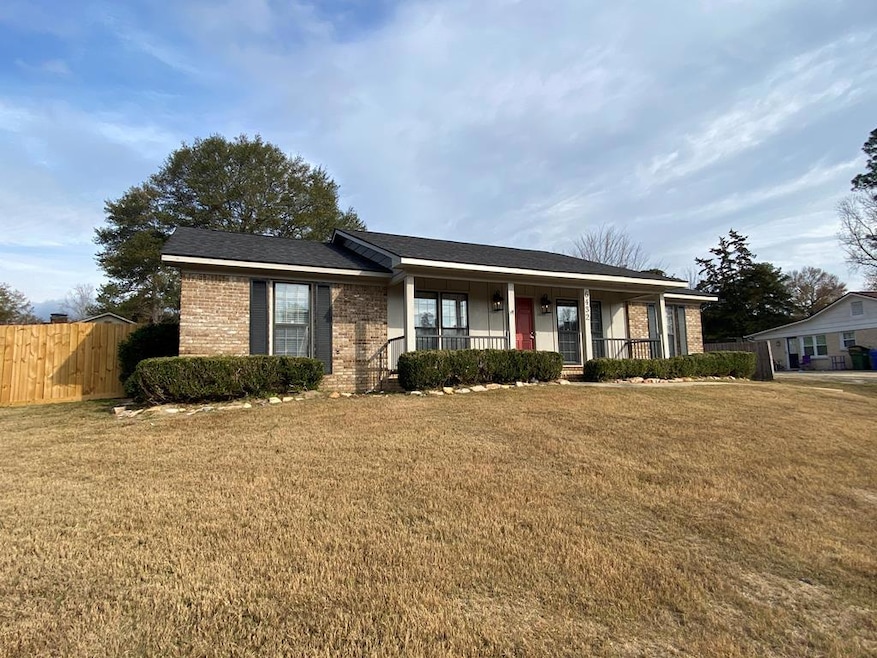
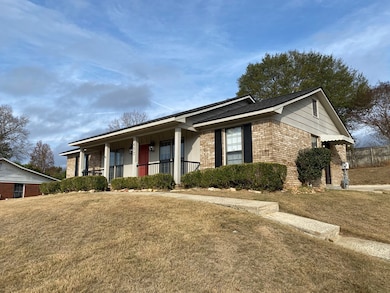
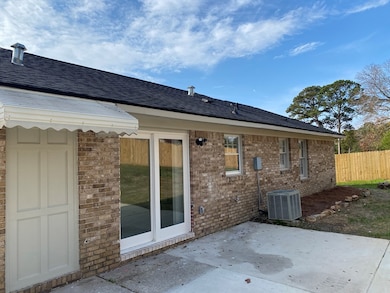
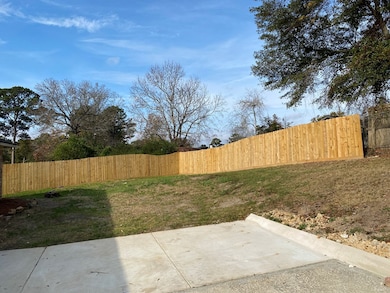
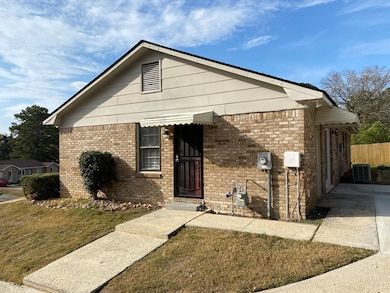
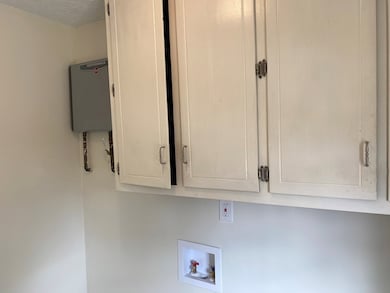
All Brick 4 bedroom 2 full bath home. New roof, tankless water heater, double sink, all stainless appliances, barn door to pantry, laundry room w/cabinets, all new light fixtures, deluxe new sliding glass door going to back patio area, privacy fenced back yard, new tile floor in kitchen & laundry room, new LVP floors throughout, new tile shower/tub in one bath and then a new tile shower in primary with nice glass doors, covered front porch, all fresh paint. Looks great and it is move in ready !
Last Agent to Sell the Property
Coldwell Banker / Kennon, Parker, Duncan & Davis Brokerage Phone: 7062561000 License #311291 Listed on: 11/25/2025

We collect this data history from publicly available records. To have your information removed, we recommend requesting removal directly through your county’s website.
| Date | Buyer | Sale Price | Title Company |
|---|---|---|---|
| Global Kingdom Work Llc | $208,000 | None Listed On Document | |
| Roman Surrae | $140,000 | None Listed On Document | |
| Smith James Nathan | -- | -- | |
| Smith James | -- | None Listed On Document | |
| Smith Norali N | -- | -- | |
| Smith Norali N | $97,900 | -- | |
| Wachovia Mtg Corp | $80,750 | -- | |
| Myers James Robert | -- | -- | |
| Howard Allena Louise | -- | Nte |
We collect this data history from publicly available records. To have your information removed, we recommend requesting removal directly through your county’s website.
| Date | Status | Borrower | Loan Amount |
|---|---|---|---|
| Open | Global Kingdom Work Llc | $166,400 | |
| Previous Owner | Smith James | $100,704 | |
| Previous Owner | Smith Norali N | $95,157 | |
| Previous Owner | Smith Norali N | $5,000 |
| Date | Event | Price | List to Sale | Price per Sq Ft |
|---|---|---|---|---|
| 01/20/2026 01/20/26 | Sold | $208,000 | -3.3% | $160 / Sq Ft |
| 12/07/2025 12/07/25 | Pending | -- | -- | -- |
| 11/25/2025 11/25/25 | For Sale | $215,000 | -- | $165 / Sq Ft |
| Year | Tax Paid | Tax Assessment Tax Assessment Total Assessment is a certain percentage of the fair market value that is determined by local assessors to be the total taxable value of land and additions on the property. | Land | Improvement |
|---|---|---|---|---|
| 2025 | $1,004 | $60,096 | $10,060 | $50,036 |
| 2024 | $1,003 | $60,096 | $10,060 | $50,036 |
| 2023 | $315 | $60,096 | $10,060 | $50,036 |
| 2022 | $1,046 | $49,364 | $10,060 | $39,304 |
| 2021 | $1,039 | $45,664 | $10,060 | $35,604 |
| 2020 | $1,039 | $45,664 | $10,060 | $35,604 |
| 2019 | $1,044 | $45,664 | $10,060 | $35,604 |
| 2018 | $1,044 | $45,664 | $10,060 | $35,604 |
| 2017 | $1,049 | $45,664 | $10,060 | $35,604 |
| 2016 | $1,055 | $38,835 | $6,928 | $31,907 |
| 2015 | $1,056 | $38,835 | $6,928 | $31,907 |
| 2014 | $1,058 | $38,835 | $6,928 | $31,907 |
| 2013 | -- | $38,835 | $6,928 | $31,907 |
K
Seller's Agent in 2026
Kent Illges
Coldwell Banker / Kennon, Parker, Duncan & Davis
(706) 256-1000
62 in this area
113 Total Sales
B
Buyer's Agent in 2026
Breunka Tucker
1st Class Real Estate Excellence
(762) 822-6410
6 in this area
20 Total Sales
Source: Columbus Board of REALTORS® (GA)
MLS Number: 224709
APN: 101-006-001
Disclaimer: Certain information contained herein is derived from information provided by parties other than Homes.com. All information provided is deemed reliable, but is not guaranteed to be accurate and should be independently verified.
![]() IDX information is provided exclusively for personal, non-commercial use, and may not be used for any purpose other than to identify prospective properties consumers may be interested in purchasing. Information is deemed reliable but not guaranteed.
IDX information is provided exclusively for personal, non-commercial use, and may not be used for any purpose other than to identify prospective properties consumers may be interested in purchasing. Information is deemed reliable but not guaranteed.
Ask me questions while you tour the home.