Estimated Value: $270,000 - $376,000
3
Beds
1
Bath
1,448
Sq Ft
$218/Sq Ft
Est. Value
About This Home
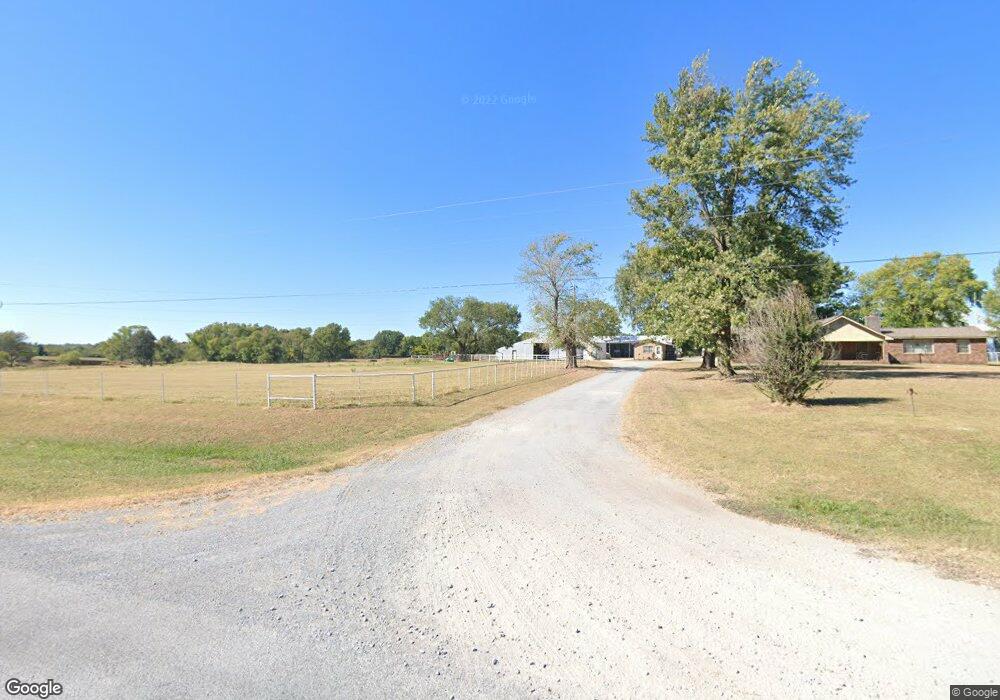
This home is located at 6435 N 433 Rd, Adair, OK 74330 and is currently estimated at $315,000, approximately $217 per square foot. 6435 N 433 Rd is a home located in Mayes County with nearby schools including Bernita Hughes Elementary School, Adair Middle School, and Adair High School.
Ownership History
Date
Name
Owned For
Owner Type
Purchase Details
Closed on
Mar 17, 2020
Sold by
Peper Shirley L and Peper Ewald
Bought by
Back Michael Dale and Back Jennifer Darlene
Current Estimated Value
Home Financials for this Owner
Home Financials are based on the most recent Mortgage that was taken out on this home.
Original Mortgage
$259,817
Outstanding Balance
$229,609
Interest Rate
3.5%
Mortgage Type
Future Advance Clause Open End Mortgage
Estimated Equity
$85,391
Purchase Details
Closed on
Nov 14, 2017
Sold by
Back Ruth M
Bought by
Peper Shirley L
Create a Home Valuation Report for This Property
The Home Valuation Report is an in-depth analysis detailing your home's value as well as a comparison with similar homes in the area
Home Values in the Area
Average Home Value in this Area
Purchase History
| Date | Buyer | Sale Price | Title Company |
|---|---|---|---|
| Back Michael Dale | $250,000 | None Available | |
| Peper Shirley L | -- | None Available |
Source: Public Records
Mortgage History
| Date | Status | Borrower | Loan Amount |
|---|---|---|---|
| Open | Back Michael Dale | $259,817 |
Source: Public Records
Tax History Compared to Growth
Tax History
| Year | Tax Paid | Tax Assessment Tax Assessment Total Assessment is a certain percentage of the fair market value that is determined by local assessors to be the total taxable value of land and additions on the property. | Land | Improvement |
|---|---|---|---|---|
| 2025 | $851 | $8,993 | $3,042 | $5,951 |
| 2023 | $851 | $8,477 | $2,818 | $5,659 |
| 2022 | $723 | $8,231 | $2,640 | $5,591 |
| 2021 | $708 | $7,991 | $2,483 | $5,508 |
| 2020 | $695 | $7,759 | $2,482 | $5,277 |
| 2019 | $699 | $7,720 | $2,479 | $5,241 |
| 2018 | $676 | $7,496 | $2,007 | $5,489 |
| 2017 | $631 | $9,237 | $3,902 | $5,335 |
| 2016 | $633 | $9,237 | $3,902 | $5,335 |
| 2015 | $638 | $9,236 | $5,118 | $4,118 |
| 2014 | $638 | $9,236 | $5,118 | $4,118 |
Source: Public Records
Map
Nearby Homes