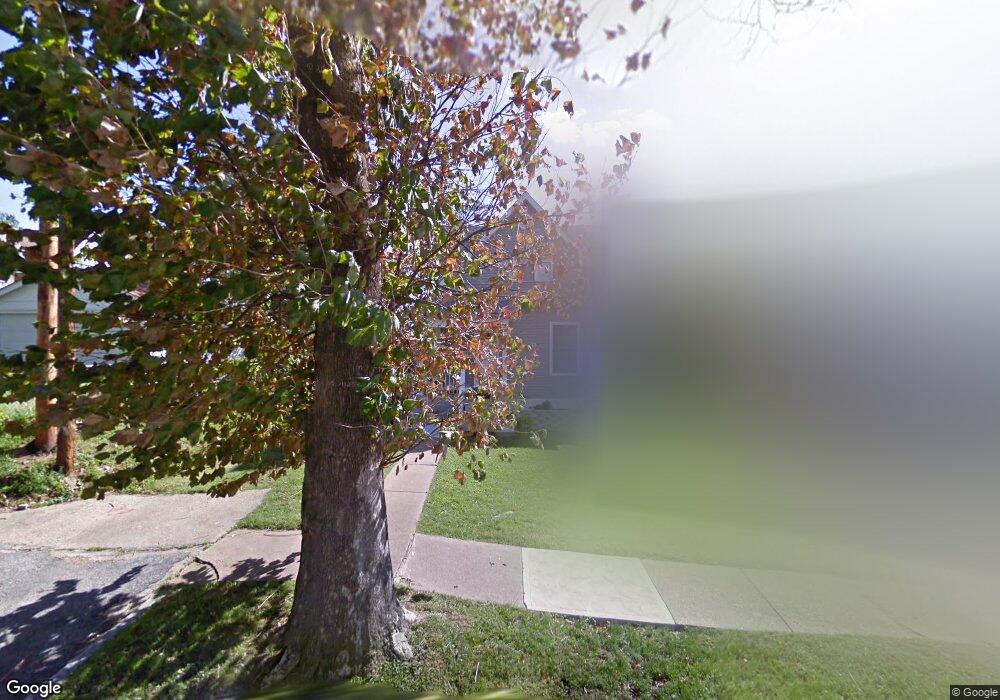
6436 Mccune Ave Saint Louis, MO 63139
Clifton Heights NeighborhoodEstimated Value: $211,000 - $252,000
Studio
1
Bath
1,500
Sq Ft
$151/Sq Ft
Est. Value
About This Home
This home is located at 6436 Mccune Ave, Saint Louis, MO 63139 and is currently estimated at $226,642, approximately $151 per square foot. 6436 Mccune Ave is a home located in St. Louis City with nearby schools including Mason Elementary School, Long International Middle School, and Roosevelt High School.
Ownership History
Date
Name
Owned For
Owner Type
Purchase Details
Closed on
Mar 24, 2005
Sold by
Eftychlou Jonathan S and Eftychlou Leigh Anne
Bought by
Hughes Rebecca E
Current Estimated Value
Home Financials for this Owner
Home Financials are based on the most recent Mortgage that was taken out on this home.
Original Mortgage
$109,650
Outstanding Balance
$55,958
Interest Rate
5.71%
Mortgage Type
Purchase Money Mortgage
Estimated Equity
$170,684
Purchase Details
Closed on
Oct 31, 2001
Sold by
Raber Janice I
Bought by
Eftychiou Jonathan S and Eftychiou Leigh Anne
Home Financials for this Owner
Home Financials are based on the most recent Mortgage that was taken out on this home.
Original Mortgage
$104,849
Interest Rate
6.52%
Mortgage Type
FHA
Purchase Details
Closed on
Aug 12, 1998
Sold by
Storey Robert L
Bought by
Raber Janice L
Create a Home Valuation Report for This Property
The Home Valuation Report is an in-depth analysis detailing your home's value as well as a comparison with similar homes in the area
Home Values in the Area
Average Home Value in this Area
Purchase History
| Date | Buyer | Sale Price | Title Company |
|---|---|---|---|
| Hughes Rebecca E | -- | U S Title | |
| Eftychiou Jonathan S | -- | -- | |
| Raber Janice L | -- | -- |
Source: Public Records
Mortgage History
| Date | Status | Borrower | Loan Amount |
|---|---|---|---|
| Open | Hughes Rebecca E | $109,650 | |
| Previous Owner | Eftychiou Jonathan S | $104,849 | |
| Closed | Hughes Rebecca E | $27,450 |
Source: Public Records
Tax History
| Year | Tax Paid | Tax Assessment Tax Assessment Total Assessment is a certain percentage of the fair market value that is determined by local assessors to be the total taxable value of land and additions on the property. | Land | Improvement |
|---|---|---|---|---|
| 2025 | $2,923 | $41,480 | $3,210 | $38,270 |
| 2024 | $2,780 | $34,580 | $3,210 | $31,370 |
| 2023 | $2,780 | $34,580 | $3,210 | $31,370 |
| 2022 | $2,609 | $31,220 | $3,210 | $28,010 |
| 2021 | $2,605 | $31,220 | $3,210 | $28,010 |
| 2020 | $2,357 | $28,440 | $3,210 | $25,230 |
| 2019 | $2,349 | $28,440 | $3,210 | $25,230 |
| 2018 | $2,095 | $24,550 | $3,210 | $21,340 |
| 2017 | $2,060 | $24,550 | $3,210 | $21,340 |
| 2016 | $1,953 | $22,970 | $3,210 | $19,760 |
| 2015 | $1,771 | $22,970 | $3,210 | $19,760 |
| 2014 | $1,741 | $22,970 | $3,210 | $19,760 |
| 2013 | -- | $22,590 | $3,210 | $19,380 |
Source: Public Records
Map
Nearby Homes
- 6452 Southwest Ave
- 6540 Mccune Ave
- 6523 Odell St
- 6266 Marmaduke Ave
- 2842 Knox Ct
- 6639 Arsenal St
- 6737 Odell St
- 3166 Tamm Ave
- 6075 Hartford St
- 5989 N Cuba Ct
- 3134 Clifton Ave
- 6034 Elizabeth Ave
- 6036 Arsenal St
- 2164 Knox Ave
- 6818 Magnolia Ave
- 6828 Magnolia Ave
- 6304 Wyoming St
- 6424 Bradley Ave
- 2138 Knox Ave
- 3205 Ivanhoe Ave
- 6442 Mccune Ave
- 6446 Mccune Ave
- 2747 Tamm Ave
- 2751 Tamm Ave
- 2739 Tamm Ave
- 6456 Mccune Ave
- 2755 Tamm Ave
- 6452 Mccune Ave
- 2759 Tamm Ave
- 6460 Mccune Ave
- 6443 Marmaduke Ave
- 6449 Marmaduke Ave
- 6441 Mccune Ave
- 6439 Mccune Ave
- 6443 Mccune Ave
- 2729 Tamm Ave
- 6447 Mccune Ave
- 6451 Marmaduke Ave
- 6455 Mccune Ave
- 2723 Tamm Ave
Your Personal Tour Guide
Ask me questions while you tour the home.