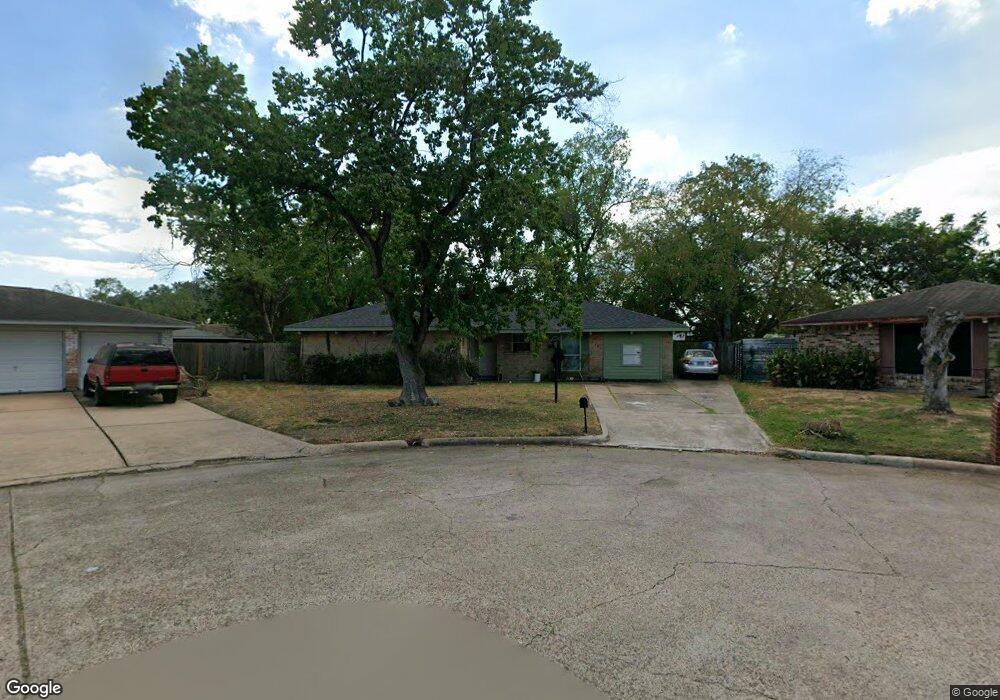
6439 Acorn Forest Dr Houston, TX 77088
Greater Inwood NeighborhoodEstimated Value: $204,000 - $234,000
3
Beds
2
Baths
1,947
Sq Ft
$112/Sq Ft
Est. Value
About This Home
This home is located at 6439 Acorn Forest Dr, Houston, TX 77088 and is currently estimated at $217,165, approximately $111 per square foot. 6439 Acorn Forest Dr is a home located in Harris County with nearby schools including Edward a Vines EC/Pre-K/K School, Ermel Elementary School, and Dr. Viola K. Garcia Middle School.
Ownership History
Date
Name
Owned For
Owner Type
Purchase Details
Closed on
May 25, 2012
Sold by
Costanzo Christian
Bought by
Gallegos Erick S and Gallegos Alma D
Current Estimated Value
Home Financials for this Owner
Home Financials are based on the most recent Mortgage that was taken out on this home.
Original Mortgage
$85,424
Outstanding Balance
$59,186
Interest Rate
3.9%
Mortgage Type
FHA
Estimated Equity
$157,979
Purchase Details
Closed on
May 4, 2011
Sold by
Secretary Of Housing & Urban Development
Bought by
Costanzo Christian
Purchase Details
Closed on
Jan 6, 2011
Sold by
Citimortgage Inc
Bought by
The Secretary Of Housing & Urban Develop
Purchase Details
Closed on
Jan 5, 2011
Sold by
Perez Rolando and Perez Nora Jean
Bought by
Citimortgage Inc
Purchase Details
Closed on
Jun 26, 1998
Sold by
Terence George Waters and Terence Patricia Ann
Bought by
Terence Nathan L and Terence Felicia S
Create a Home Valuation Report for This Property
The Home Valuation Report is an in-depth analysis detailing your home's value as well as a comparison with similar homes in the area
Home Values in the Area
Average Home Value in this Area
Purchase History
| Date | Buyer | Sale Price | Title Company |
|---|---|---|---|
| Gallegos Erick S | -- | None Available | |
| Costanzo Christian | -- | None Available | |
| The Secretary Of Housing & Urban Develop | -- | None Available | |
| Citimortgage Inc | $98,631 | None Available | |
| Terence Nathan L | -- | Regency Title |
Source: Public Records
Mortgage History
| Date | Status | Borrower | Loan Amount |
|---|---|---|---|
| Open | Gallegos Erick S | $85,424 |
Source: Public Records
Tax History Compared to Growth
Tax History
| Year | Tax Paid | Tax Assessment Tax Assessment Total Assessment is a certain percentage of the fair market value that is determined by local assessors to be the total taxable value of land and additions on the property. | Land | Improvement |
|---|---|---|---|---|
| 2025 | $2,733 | $206,655 | $55,738 | $150,917 |
| 2024 | $2,733 | $202,036 | $55,738 | $146,298 |
| 2023 | $2,733 | $193,615 | $55,738 | $137,877 |
| 2022 | $3,669 | $178,674 | $55,738 | $122,936 |
| 2021 | $3,493 | $139,051 | $17,751 | $121,300 |
| 2020 | $3,405 | $139,788 | $17,751 | $122,037 |
| 2019 | $3,245 | $117,263 | $13,491 | $103,772 |
| 2018 | $1,295 | $115,184 | $13,491 | $101,693 |
| 2017 | $2,978 | $115,184 | $13,491 | $101,693 |
| 2016 | $2,707 | $105,034 | $13,491 | $91,543 |
| 2015 | $1,832 | $105,034 | $13,491 | $91,543 |
| 2014 | $1,832 | $84,335 | $13,491 | $70,844 |
Source: Public Records
Map
Nearby Homes
- 6338 Maple Hill Dr
- 6310 Silver Chalice Dr
- 6407 Deirdre Anne Dr
- 6931 Wagonwheel Ln
- 6202 Wagonwheel Cir
- 6902 Anson Point Ln
- 8610 Twillingate Ln
- 6918 Bent Branch Dr
- 7218 Jadewood Dr Unit 770
- 7146 Bayou Forest Dr
- 8615 Black Tern Ln
- 7606 Victory Dr
- 7219 Ridge Oak Dr
- 6311 Fairwood Dr
- 6430 Pirtlewood Cir
- 7218 Stonegate Dr
- 7402 Alabonson Rd Unit 506
- 7402 Alabonson Rd Unit 309
- 7402 Alabonson Rd Unit 510
- 7402 Alabonson Rd Unit 108
- 6435 Acorn Forest Dr
- 6442 Acorn Forest Dr
- 6438 Maple Hill Dr
- 6434 Maple Hill Dr
- 6431 Acorn Forest Dr
- 6438 Acorn Forest Dr
- 6430 Maple Hill Dr
- 6442 Maple Hill Dr
- 6434 Acorn Forest Dr
- 6427 Acorn Forest Dr
- 6426 Maple Hill Dr
- 6430 Acorn Forest Dr
- 6423 Acorn Forest Dr
- 6426 Acorn Forest Dr
- 6439 Maple Hill Dr
- 6422 Maple Hill Dr
- 6443 Oaknut Dr
- 6439 Oaknut Dr
- 6435 Maple Hill Dr
- 6435 Oaknut Dr