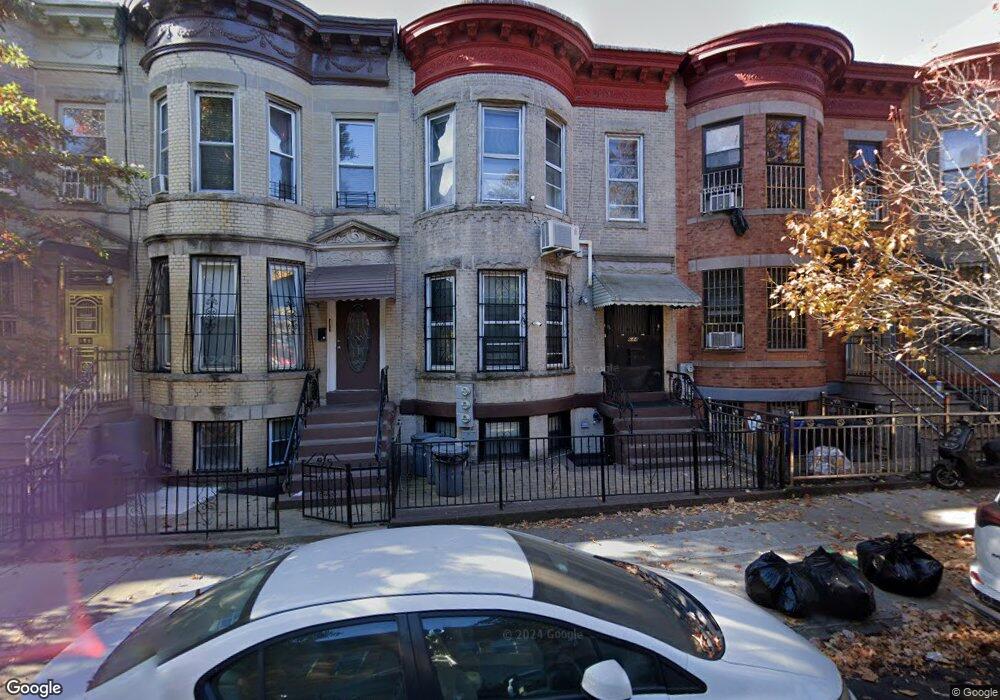
644 49th St Brooklyn, NY 11220
Sunset Park NeighborhoodEstimated Value: $1,264,181 - $1,714,000
Studio
--
Bath
2,018
Sq Ft
$757/Sq Ft
Est. Value
About This Home
This home is located at 644 49th St, Brooklyn, NY 11220 and is currently estimated at $1,527,795, approximately $757 per square foot. 644 49th St is a home located in Kings County with nearby schools including P.S. 94 The Henry Longfellow School, IS 220 John J. Pershing, and Leep Dual Language Academy Charter School.
Ownership History
Date
Name
Owned For
Owner Type
Purchase Details
Closed on
Dec 28, 2010
Sold by
Huang Barbara Suihong and Huang Jon
Bought by
Huang Barbara Suihong and Huang Jon
Current Estimated Value
Purchase Details
Closed on
Apr 21, 2007
Sold by
Huang Barbara Suihong and Huang Zhen Hui
Bought by
Huang Barbara Suihong and Huang Jon
Purchase Details
Closed on
May 5, 2000
Sold by
Huang Zhen Hui
Bought by
Huang Zhen Hui and Huang Barbara Suihong
Create a Home Valuation Report for This Property
The Home Valuation Report is an in-depth analysis detailing your home's value as well as a comparison with similar homes in the area
Home Values in the Area
Average Home Value in this Area
Purchase History
| Date | Buyer | Sale Price | Title Company |
|---|---|---|---|
| Huang Barbara Suihong | -- | -- | |
| Huang Barbara Suihong | -- | -- | |
| Huang Barbara Suihong | -- | -- | |
| Huang Barbara Suihong | -- | -- | |
| Huang Zhen Hui | -- | -- | |
| Huang Zhen Hui | -- | -- |
Source: Public Records
Tax History
| Year | Tax Paid | Tax Assessment Tax Assessment Total Assessment is a certain percentage of the fair market value that is determined by local assessors to be the total taxable value of land and additions on the property. | Land | Improvement |
|---|---|---|---|---|
| 2025 | $7,059 | $72,240 | $25,920 | $46,320 |
| 2024 | $7,059 | $84,960 | $25,920 | $59,040 |
| 2023 | $6,723 | $83,100 | $25,920 | $57,180 |
| 2022 | $5,892 | $71,820 | $25,920 | $45,900 |
| 2021 | $6,136 | $70,380 | $25,920 | $44,460 |
| 2020 | $6,207 | $78,840 | $25,920 | $52,920 |
| 2019 | $6,078 | $87,180 | $25,920 | $61,260 |
| 2018 | $5,564 | $28,753 | $10,049 | $18,704 |
| 2017 | $5,233 | $27,139 | $10,496 | $16,643 |
| 2016 | $4,811 | $25,618 | $10,745 | $14,873 |
| 2015 | $2,868 | $25,603 | $12,072 | $13,531 |
| 2014 | $2,868 | $25,380 | $14,232 | $11,148 |
Source: Public Records
Map
Nearby Homes
Your Personal Tour Guide
Ask me questions while you tour the home.