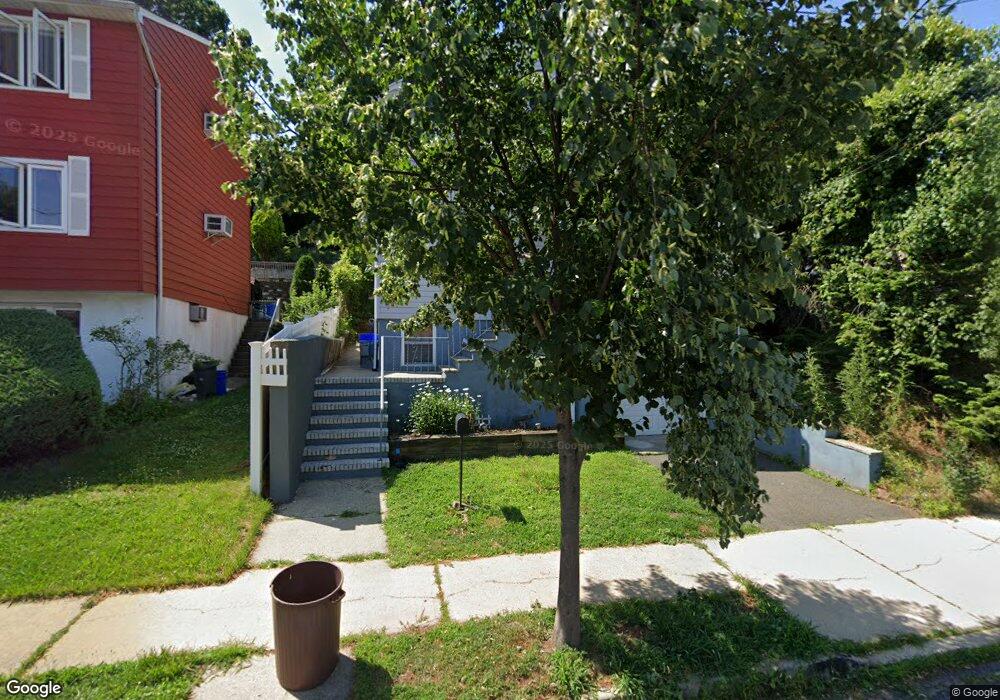
644 5th St Carlstadt, NJ 07072
Estimated Value: $548,749 - $649,000
--
Bed
--
Bath
1,534
Sq Ft
$390/Sq Ft
Est. Value
About This Home
This home is located at 644 5th St, Carlstadt, NJ 07072 and is currently estimated at $598,187, approximately $389 per square foot. 644 5th St is a home located in Bergen County with nearby schools including Carlstadt Public School, Henry P Becton Regional High School, and Montessori School of East Rutherford.
Ownership History
Date
Name
Owned For
Owner Type
Purchase Details
Closed on
Nov 17, 2010
Sold by
Christeson Diane
Bought by
Marko Christopher G and Marko Tina M
Current Estimated Value
Home Financials for this Owner
Home Financials are based on the most recent Mortgage that was taken out on this home.
Original Mortgage
$305,880
Interest Rate
4.37%
Mortgage Type
FHA
Create a Home Valuation Report for This Property
The Home Valuation Report is an in-depth analysis detailing your home's value as well as a comparison with similar homes in the area
Home Values in the Area
Average Home Value in this Area
Purchase History
| Date | Buyer | Sale Price | Title Company |
|---|---|---|---|
| Marko Christopher G | $310,000 | -- |
Source: Public Records
Mortgage History
| Date | Status | Borrower | Loan Amount |
|---|---|---|---|
| Previous Owner | Marko Christopher G | $305,880 |
Source: Public Records
Tax History Compared to Growth
Tax History
| Year | Tax Paid | Tax Assessment Tax Assessment Total Assessment is a certain percentage of the fair market value that is determined by local assessors to be the total taxable value of land and additions on the property. | Land | Improvement |
|---|---|---|---|---|
| 2025 | $6,820 | $427,800 | $248,700 | $179,100 |
| 2024 | $6,137 | $410,600 | $236,200 | $174,400 |
| 2023 | $5,883 | $373,100 | $208,700 | $164,400 |
| 2022 | $5,883 | $348,500 | $191,100 | $157,400 |
| 2021 | $5,981 | $329,900 | $178,600 | $151,300 |
| 2020 | $5,657 | $318,700 | $173,600 | $145,100 |
| 2019 | $5,639 | $307,300 | $171,100 | $136,200 |
| 2018 | $5,839 | $303,800 | $168,600 | $135,200 |
| 2017 | $5,705 | $299,300 | $166,100 | $133,200 |
| 2016 | $6,737 | $316,900 | $213,900 | $103,000 |
| 2015 | $6,560 | $316,900 | $213,900 | $103,000 |
| 2014 | $6,309 | $316,900 | $213,900 | $103,000 |
Source: Public Records
Map
Nearby Homes
- 38 Hackensack St
- 30 Humboldt St
- 340 Marsan Dr
- 53 Hackensack St
- 522 9th St
- 88 Columbia St
- 426 Broad St
- 89 Rose St
- 344 10th St
- 507 Washington St
- 451 Hoboken Rd
- 148 Hackensack St
- 573 Anderson Ave
- 327 Madison St
- 165 Madison St
- 167 Columbia St
- 409 Washington St
- 592 Central Ave
- 176 Hackensack St Unit 6
- 206 Columbia St