Estimated Value: $176,138 - $242,000
4
Beds
4
Baths
2,372
Sq Ft
$90/Sq Ft
Est. Value
About This Home
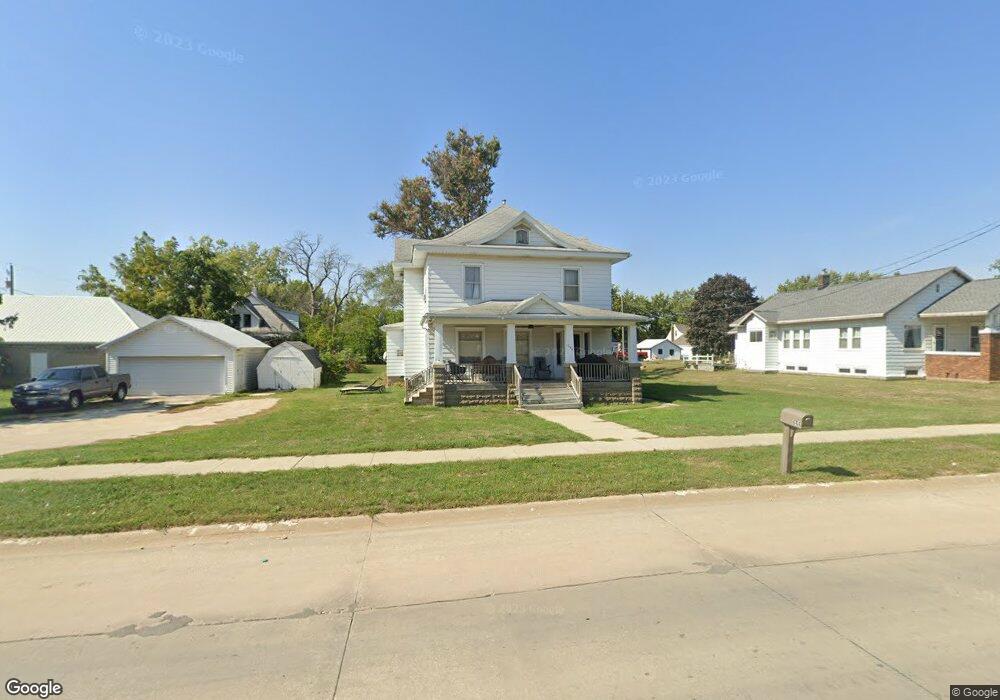
This home is located at 644 6th St, Jesup, IA 50648 and is currently estimated at $213,285, approximately $89 per square foot. 644 6th St is a home located in Buchanan County with nearby schools including Jesup Elementary School, Jesup Middle School, and Jesup High School.
Ownership History
Date
Name
Owned For
Owner Type
Purchase Details
Closed on
Aug 22, 2025
Sold by
Atkins Shannon R and Ruroden Shannon R
Bought by
Ruroden Shannon R and Ruroden Nicholas S
Current Estimated Value
Home Financials for this Owner
Home Financials are based on the most recent Mortgage that was taken out on this home.
Original Mortgage
$141,650
Outstanding Balance
$141,160
Interest Rate
5.92%
Mortgage Type
New Conventional
Estimated Equity
$72,125
Create a Home Valuation Report for This Property
The Home Valuation Report is an in-depth analysis detailing your home's value as well as a comparison with similar homes in the area
Home Values in the Area
Average Home Value in this Area
Purchase History
| Date | Buyer | Sale Price | Title Company |
|---|---|---|---|
| Ruroden Shannon R | -- | None Listed On Document |
Source: Public Records
Mortgage History
| Date | Status | Borrower | Loan Amount |
|---|---|---|---|
| Open | Ruroden Shannon R | $141,650 |
Source: Public Records
Tax History
| Year | Tax Paid | Tax Assessment Tax Assessment Total Assessment is a certain percentage of the fair market value that is determined by local assessors to be the total taxable value of land and additions on the property. | Land | Improvement |
|---|---|---|---|---|
| 2025 | $2,376 | $161,520 | $31,010 | $130,510 |
| 2024 | $2,376 | $140,100 | $27,690 | $112,410 |
| 2023 | $2,302 | $140,100 | $27,690 | $112,410 |
| 2022 | $2,094 | $112,200 | $21,980 | $90,220 |
| 2021 | $2,040 | $112,200 | $21,980 | $90,220 |
| 2020 | $2,040 | $103,440 | $20,150 | $83,290 |
| 2019 | $1,984 | $103,440 | $20,150 | $83,290 |
| 2018 | $1,878 | $100,470 | $20,150 | $80,320 |
| 2017 | $1,818 | $100,470 | $20,150 | $80,320 |
| 2016 | $1,772 | $95,740 | $10,900 | $84,840 |
| 2015 | $1,772 | $95,740 | $10,900 | $84,840 |
| 2014 | $1,802 | $95,740 | $10,900 | $84,840 |
Source: Public Records
Map
Nearby Homes
- 435 5th St
- 1634 Dalton St
- 414 Main St
- 915 Young St
- 814 Duroe St
- 524 Christopher Cir
- 1124 3rd St
- 1225 1st St
- 1225 10th St
- 1245 Hawley St
- 0 220th St
- 1644 Killarney Dr
- 1341 12th St
- Lot 7 Dalton St
- Lot 4 Benson Shady Grove Ave
- Lot 2 Benson Shady Grove Ave
- Lot 1 Benson Shady Grove Ave
- 0 Benson Ridge Addition Unit Lot 7
- 0 Benson Ridge Addition Unit Lot 1
- 0 Benson Ridge Addition Unit Lot 2
Your Personal Tour Guide
Ask me questions while you tour the home.