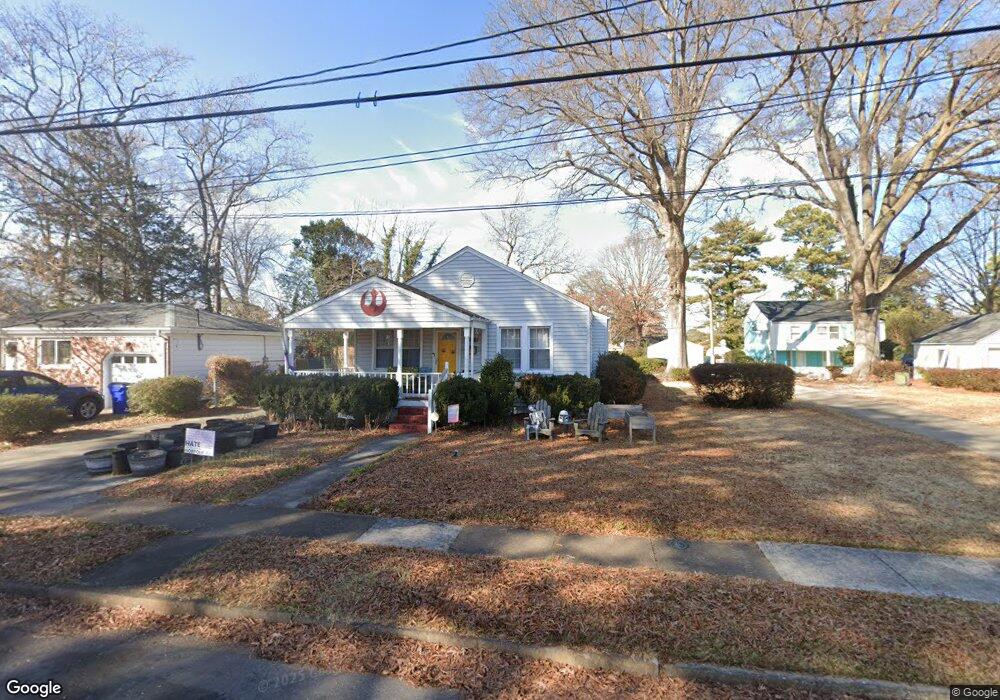
644 Dune St Norfolk, VA 23503
Northside NeighborhoodEstimated Value: $204,000 - $306,000
About This Home
This home is located at 644 Dune St, Norfolk, VA 23503 and is currently estimated at $269,815, approximately $185 per square foot. 644 Dune St is a home located in Norfolk City with nearby schools including Mary Calcott Elementary School, Northside Middle School, and Granby High School.
Ownership History
We collect this data history from publicly available records. To have your information removed, we recommend requesting removal directly through your county’s website.
Purchase Details
Home Financials for this Owner
Home Financials are based on the most recent Mortgage that was taken out on this home.Purchase Details
Home Financials for this Owner
Home Financials are based on the most recent Mortgage that was taken out on this home.Purchase Details
Home Financials for this Owner
Home Financials are based on the most recent Mortgage that was taken out on this home.Home Values in the Area
Average Home Value in this Area
Purchase History
We collect this data history from publicly available records. To have your information removed, we recommend requesting removal directly through your county’s website.
| Date | Buyer | Sale Price | Title Company |
|---|---|---|---|
| $170,000 | Barristers Of Virginia | ||
| -- | None Available | ||
| $210,000 | Preferred Escrow & Title |
Mortgage History
We collect this data history from publicly available records. To have your information removed, we recommend requesting removal directly through your county’s website.
| Date | Status | Borrower | Loan Amount |
|---|---|---|---|
| Open | $166,920 | ||
| Previous Owner | $207,602 | ||
| Previous Owner | $214,515 |
Tax History
We collect this data history from publicly available records. To have your information removed, we recommend requesting removal directly through your county’s website.
| Year | Tax Paid | Tax Assessment Tax Assessment Total Assessment is a certain percentage of the fair market value that is determined by local assessors to be the total taxable value of land and additions on the property. | Land | Improvement |
|---|---|---|---|---|
| 2025 | $2,954 | $240,200 | $62,000 | $178,200 |
| 2024 | $2,919 | $237,300 | $62,000 | $175,300 |
| 2023 | $2,861 | $228,900 | $62,000 | $166,900 |
| 2022 | $2,756 | $220,500 | $55,000 | $165,500 |
| 2021 | $2,550 | $204,000 | $50,500 | $153,500 |
| 2020 | $2,406 | $192,500 | $44,000 | $148,500 |
| 2019 | $2,356 | $188,500 | $40,000 | $148,500 |
| 2018 | $2,165 | $173,200 | $40,000 | $133,200 |
| 2017 | $1,954 | $169,900 | $40,000 | $129,900 |
| 2016 | $1,954 | $173,000 | $40,000 | $133,000 |
| 2015 | $1,990 | $173,000 | $40,000 | $133,000 |
| 2014 | $1,990 | $173,000 | $40,000 | $133,000 |
Map
- 1000 Dune St
- 511 Dune St
- 1019 Beach View St
- 8911 London St
- 8641 Chapin St
- 423 Fresh Meadow Rd
- 8916 London St
- 8629 Chapin St
- 8621 Chapin St
- 500 E Bayview Blvd
- 417 E Westmont Ave
- 1059 Warwick Ave
- 8535 Old Ocean View Rd
- 403 Fresh Meadow Rd
- 8913 Hastings St
- 8710 Tidewater Dr
- 719 Dudley Ave
- 429 E Bayview Blvd
- 9318 Chesapeake St
- 1147 Modoc Ave
Ask me questions while you tour the home.