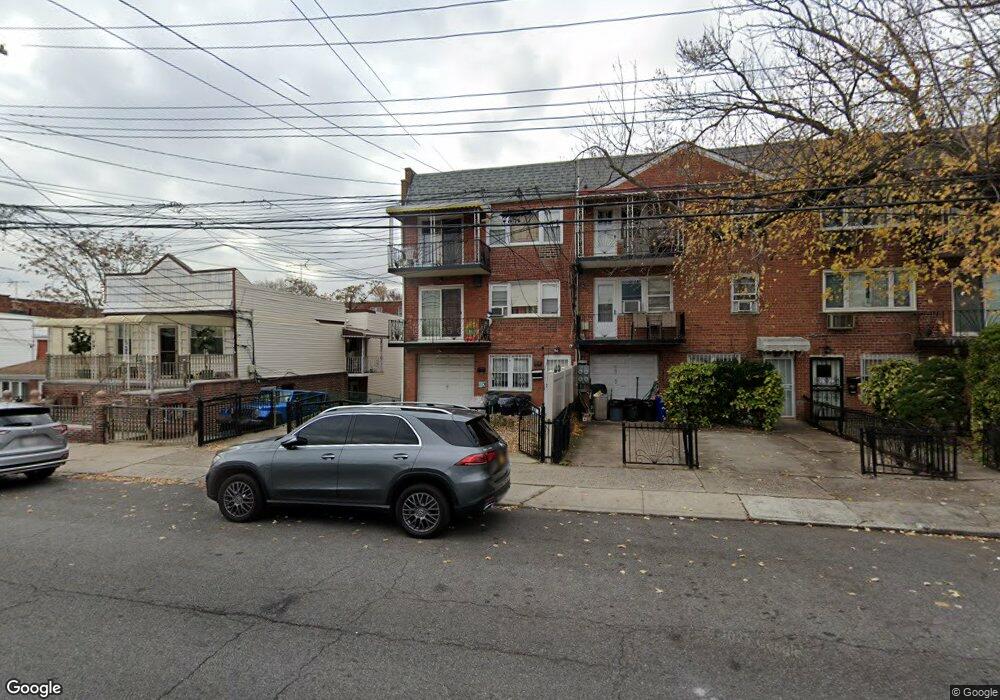
644 E 85th St Brooklyn, NY 11236
Canarsie NeighborhoodEstimated Value: $1,039,000 - $1,188,000
Studio
--
Bath
3,430
Sq Ft
$325/Sq Ft
Est. Value
About This Home
This home is located at 644 E 85th St, Brooklyn, NY 11236 and is currently estimated at $1,115,432, approximately $325 per square foot. 644 E 85th St is a home located in Kings County with nearby schools including P.S. 114 Ryder Elementary School, Is 68 Isaac Bildersee, and Explore Excel Charter School.
Ownership History
Date
Name
Owned For
Owner Type
Purchase Details
Closed on
Feb 24, 2021
Sold by
Blackwood Sharon
Bought by
Blackwood Sharon and Smith Junius
Current Estimated Value
Purchase Details
Closed on
Feb 18, 2010
Sold by
Blackwood Sharon and Kitson Black
Bought by
Blackwood Sharon and Kitson Black
Home Financials for this Owner
Home Financials are based on the most recent Mortgage that was taken out on this home.
Original Mortgage
$407,000
Outstanding Balance
$267,099
Interest Rate
5.02%
Mortgage Type
Purchase Money Mortgage
Estimated Equity
$848,333
Purchase Details
Closed on
Oct 25, 2007
Sold by
Blackwood Sharon and Whitfield Gary
Bought by
Black Kitson and Blackwood Sharon
Purchase Details
Closed on
Sep 30, 1999
Sold by
Laguerre Maryse
Bought by
Blackwood Sharon and Whitfield Gary
Home Financials for this Owner
Home Financials are based on the most recent Mortgage that was taken out on this home.
Original Mortgage
$235,175
Interest Rate
7.79%
Mortgage Type
FHA
Create a Home Valuation Report for This Property
The Home Valuation Report is an in-depth analysis detailing your home's value as well as a comparison with similar homes in the area
Home Values in the Area
Average Home Value in this Area
Purchase History
| Date | Buyer | Sale Price | Title Company |
|---|---|---|---|
| Blackwood Sharon | -- | -- | |
| Blackwood Sharon | -- | -- | |
| Blackwood Sharon | -- | -- | |
| Blackwood Sharon | -- | -- | |
| Black Kitson | -- | -- | |
| Black Kitson | -- | -- | |
| Blackwood Sharon | $330,000 | Chicago Title Insurance Co | |
| Blackwood Sharon | $330,000 | Chicago Title Insurance Co |
Source: Public Records
Mortgage History
| Date | Status | Borrower | Loan Amount |
|---|---|---|---|
| Open | Blackwood Sharon | $407,000 | |
| Closed | Blackwood Sharon | $407,000 | |
| Previous Owner | Blackwood Sharon | $235,175 | |
| Closed | Black Kitson | $0 |
Source: Public Records
Tax History
| Year | Tax Paid | Tax Assessment Tax Assessment Total Assessment is a certain percentage of the fair market value that is determined by local assessors to be the total taxable value of land and additions on the property. | Land | Improvement |
|---|---|---|---|---|
| 2025 | $10,116 | $63,780 | $17,580 | $46,200 |
| 2024 | $10,116 | $63,480 | $17,580 | $45,900 |
| 2023 | $10,025 | $59,460 | $17,580 | $41,880 |
| 2022 | $9,458 | $65,160 | $17,580 | $47,580 |
| 2021 | $9,905 | $52,740 | $17,580 | $35,160 |
| 2020 | $4,636 | $43,140 | $17,580 | $25,560 |
| 2019 | $8,732 | $43,140 | $17,580 | $25,560 |
| 2018 | $8,325 | $42,301 | $12,884 | $29,417 |
| 2017 | $7,993 | $40,680 | $17,580 | $23,100 |
| 2016 | $8,082 | $41,980 | $17,497 | $24,483 |
| 2015 | $4,593 | $39,604 | $16,109 | $23,495 |
| 2014 | $4,593 | $37,364 | $12,927 | $24,437 |
Source: Public Records
Map
Nearby Homes
- 670 E 85th St
- 623 E 85th St
- 665 Varkens Hook Rd
- 645 E 87th St
- 661 E 87th St
- 727 E 83rd St
- 760 E 86th St
- 618 E 89th St
- 629 E 89th St
- 8317 Flatlands Ave
- 548 E 87th St Unit 1
- 732 E 82nd St
- 707 E 81st St
- 8811 Bedell Ln
- 582 E 82nd St
- 522 E 86th St
- 923 E 85th St
- 1038 Remsen Ave
- 921 E 84th St
- 565 E 81st St
- 642 E 85th St
- 646 E 85th St
- 640 E 85th St Unit 4
- 640 E 85th St Unit 3
- 648 E 85th St
- 650 E 85th St
- 638 E 85th St
- 647 E 84th St
- 651 E 84th St
- 652 E 85th St
- 645 E 84th St
- 636 E 85th St
- 659 E 84th St
- 643 E 84th St
- 641 E 84th St
- 668 E 85th St
- 661 E 84th St
- 634A E 85th St
- 639 E 84th St
- 639 E 84th St Unit 1
Your Personal Tour Guide
Ask me questions while you tour the home.