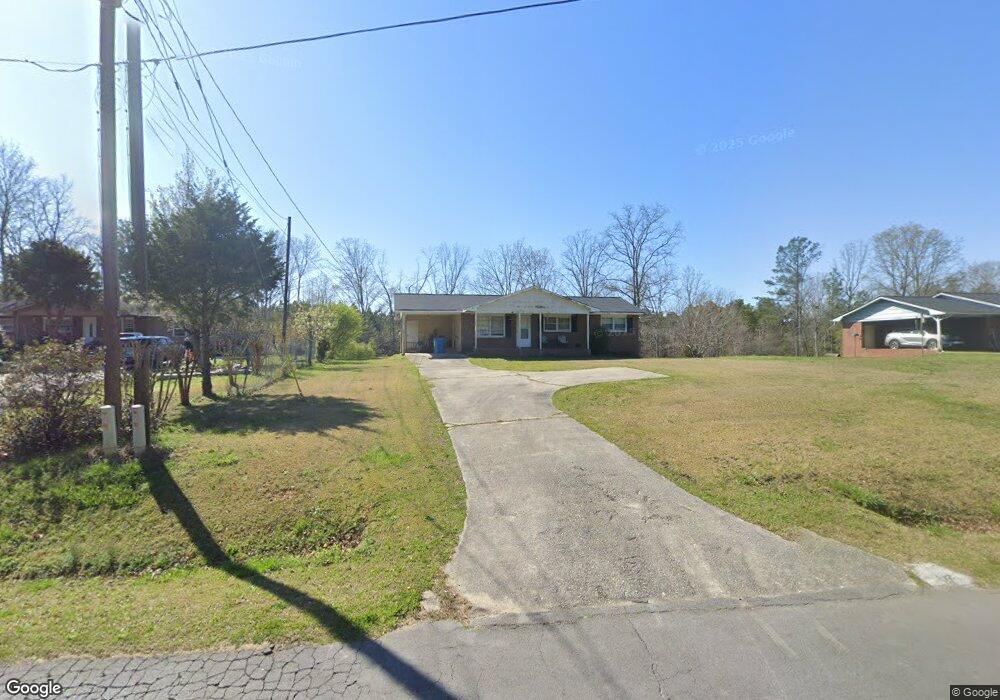
644 E Point Rd Cedartown, GA 30125
Estimated Value: $106,000 - $213,000
3
Beds
1
Bath
1,061
Sq Ft
$154/Sq Ft
Est. Value
About This Home
This home is located at 644 E Point Rd, Cedartown, GA 30125 and is currently estimated at $163,026, approximately $153 per square foot. 644 E Point Rd is a home located in Polk County with nearby schools including Cedar Christian School and Vineyard Harvester Christian Academy.
Ownership History
Date
Name
Owned For
Owner Type
Purchase Details
Closed on
Feb 14, 2014
Sold by
Mann Theo D
Bought by
Sanchez Ermilo and Sanchez Cathy
Current Estimated Value
Purchase Details
Closed on
Mar 28, 2003
Sold by
Hicks David J
Bought by
Hicks John N and Hicks Sheryl C
Purchase Details
Closed on
Jun 12, 2001
Sold by
Hicks James N
Bought by
Hicks David J
Purchase Details
Closed on
Sep 23, 1988
Sold by
Usa Acting Thru Fmha
Bought by
Hicks James N
Purchase Details
Closed on
Dec 1, 1986
Sold by
Holmes Cynthia Nmi
Bought by
Farmers Home Admin
Purchase Details
Closed on
Feb 27, 1985
Sold by
Farmers Home Admin
Bought by
Holmes Cynthia Nmi
Purchase Details
Closed on
Feb 14, 1984
Sold by
Wyatt Brenda
Bought by
Farmers Home Admin
Purchase Details
Closed on
Sep 1, 1982
Sold by
Parks Robert L
Bought by
Wyatt Brenda
Purchase Details
Closed on
Nov 3, 1981
Sold by
Hopkins Daniel M and Peter O'Callaghan J T
Bought by
Parks Robert L
Create a Home Valuation Report for This Property
The Home Valuation Report is an in-depth analysis detailing your home's value as well as a comparison with similar homes in the area
Purchase History
| Date | Buyer | Sale Price | Title Company |
|---|---|---|---|
| Sanchez Ermilo | $31,500 | -- | |
| Hicks John N | -- | -- | |
| Hicks David J | $12,000 | -- | |
| Hicks James N | -- | -- | |
| Farmers Home Admin | -- | -- | |
| Holmes Cynthia Nmi | -- | -- | |
| Farmers Home Admin | -- | -- | |
| Wyatt Brenda | -- | -- | |
| Parks Robert L | -- | -- |
Source: Public Records
Tax History
| Year | Tax Paid | Tax Assessment Tax Assessment Total Assessment is a certain percentage of the fair market value that is determined by local assessors to be the total taxable value of land and additions on the property. | Land | Improvement |
|---|---|---|---|---|
| 2025 | $890 | $39,559 | $2,436 | $37,123 |
| 2024 | $811 | $38,784 | $1,661 | $37,123 |
| 2023 | $596 | $25,103 | $1,661 | $23,442 |
| 2022 | $502 | $21,139 | $1,107 | $20,032 |
| 2021 | $508 | $21,139 | $1,107 | $20,032 |
| 2020 | $509 | $21,139 | $1,107 | $20,032 |
| 2019 | $539 | $20,089 | $1,107 | $18,982 |
| 2018 | $537 | $19,481 | $1,107 | $18,374 |
| 2017 | $530 | $19,481 | $1,107 | $18,374 |
| 2016 | $560 | $20,570 | $2,196 | $18,374 |
| 2015 | $344 | $20,729 | $2,196 | $18,533 |
| 2014 | $515 | $20,729 | $2,196 | $18,533 |
Source: Public Records
Map
Nearby Homes
- 0 Coaling Rd Unit 9221-D 10352096
- 0 Coaling Rd Unit 9221-C 10352086
- 0 Coaling Rd Unit 9221 10352063
- 0 Coaling Rd Unit 9221-B 10352079
- 873 E Point Rd
- 202 Ridgewood Rd
- 10 Woodglen Dr
- 305 Greenview Ct
- 00 Juliette St
- 117 Hicklen Dr
- 0 Woodall Rd Unit 7730884
- 0 Woodall Rd Unit 10705831
- 232 Tuck St
- 1101 East Ave
- 55 Lovvorn Rd
- 117 Cason Rd
- 427 Park St
- 206 Turner St
- 645 Valley Rd
- 315 Jones St
- 654 E Point Rd
- 634 E Point Rd
- 664 E Point Rd
- 624 E Point Rd
- 674 E Point Rd
- 0 Coaling Rd
- 0 Coaling Rd Unit 7460783
- 0 Coaling Rd Unit 7319399
- 0 Coaling Rd Unit R8-1133 8972438
- 0 Coaling Rd Unit 8308697
- 0 Coaling Rd Unit 8891465
- 603 E Point Rd
- 578 E Point Rd
- 568 E Point Rd
- 558 E Point Rd
- 52 Coaling Rd
- 52 Coaling Rd
- 71 Coaling Rd
- 85 Coaling Rd
- 743 E Point Rd
Your Personal Tour Guide
Ask me questions while you tour the home.