Estimated Value: $125,000 - $167,000
Studio
2
Baths
2,688
Sq Ft
$55/Sq Ft
Est. Value
About This Home
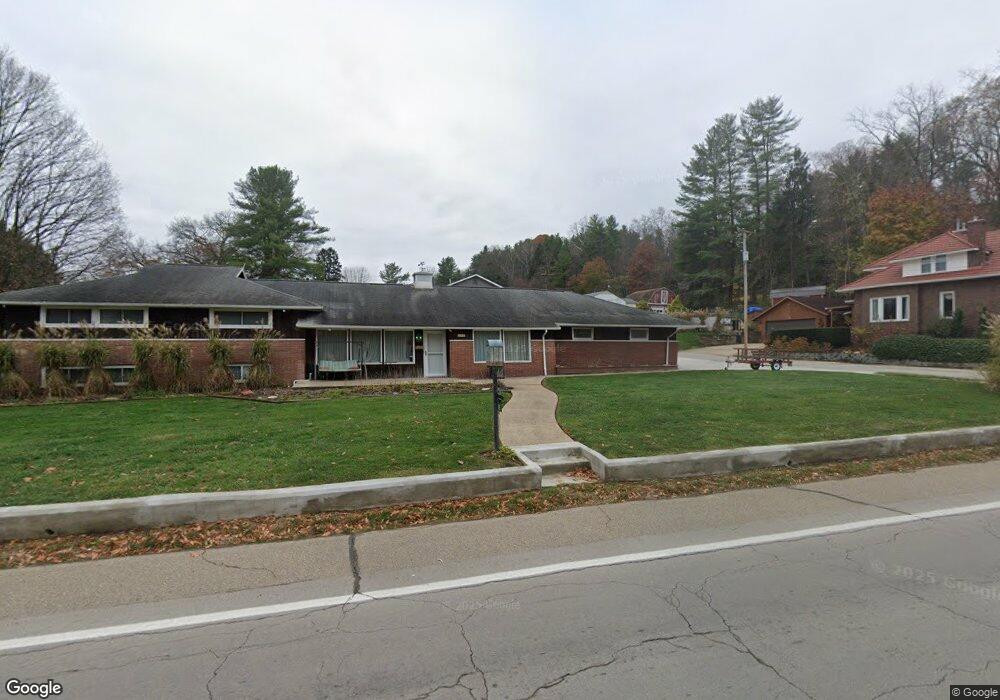
This home is located at 644 Mohican Ave Unit 646, Logan, OH 43138 and is currently estimated at $147,333, approximately $54 per square foot. 644 Mohican Ave Unit 646 is a home located in Hocking County with nearby schools including Central Elementary School, Logan Christian School, and St. John the Evangelist School.
Ownership History
Date
Name
Owned For
Owner Type
Purchase Details
Closed on
Feb 7, 2023
Sold by
King Kimberly N and King Tyler L
Bought by
Last On Mohican Llc
Current Estimated Value
Purchase Details
Closed on
Aug 6, 2008
Sold by
Miller Kim M
Bought by
King Kimberly N
Purchase Details
Closed on
Feb 22, 2007
Sold by
Miller Kim M
Bought by
Miller Kimberly N and King Tyler L
Purchase Details
Closed on
May 2, 2005
Sold by
King Mary Ann
Bought by
Miller Kim M and Mary Ann King Living Trust
Create a Home Valuation Report for This Property
The Home Valuation Report is an in-depth analysis detailing your home's value as well as a comparison with similar homes in the area
Home Values in the Area
Average Home Value in this Area
Purchase History
| Date | Buyer | Sale Price | Title Company |
|---|---|---|---|
| Last On Mohican Llc | -- | None Listed On Document | |
| King Kimberly N | $26,400 | None Available | |
| Miller Kimberly N | $115,000 | None Available | |
| Miller Kim M | -- | None Available |
Source: Public Records
Tax History
| Year | Tax Paid | Tax Assessment Tax Assessment Total Assessment is a certain percentage of the fair market value that is determined by local assessors to be the total taxable value of land and additions on the property. | Land | Improvement |
|---|---|---|---|---|
| 2024 | $1,481 | $36,700 | $4,920 | $31,780 |
| 2023 | $1,481 | $36,700 | $4,920 | $31,780 |
| 2022 | $1,484 | $36,700 | $4,920 | $31,780 |
| 2021 | $1,285 | $29,470 | $3,870 | $25,600 |
| 2020 | $1,286 | $29,470 | $3,870 | $25,600 |
| 2019 | $1,286 | $29,470 | $3,870 | $25,600 |
| 2018 | $1,187 | $27,670 | $3,290 | $24,380 |
| 2017 | $1,120 | $27,670 | $3,290 | $24,380 |
| 2016 | $1,112 | $27,670 | $3,290 | $24,380 |
| 2015 | $841 | $20,160 | $3,290 | $16,870 |
| 2014 | $841 | $20,160 | $3,290 | $16,870 |
| 2013 | $845 | $20,160 | $3,290 | $16,870 |
Source: Public Records
Map
Nearby Homes
Your Personal Tour Guide
Ask me questions while you tour the home.