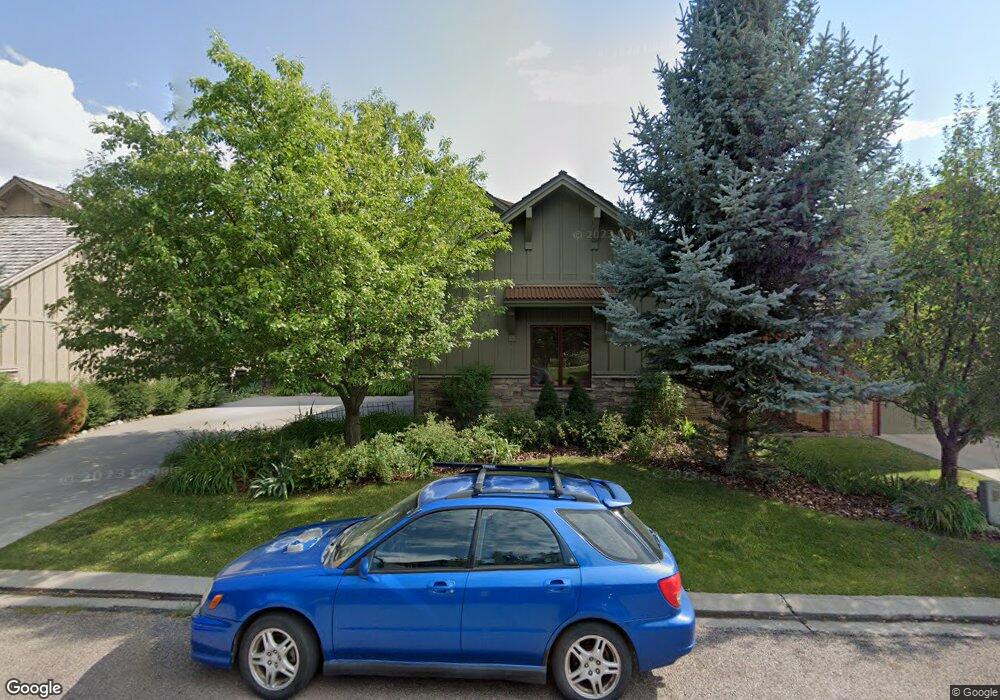
644 N Bridge Dr Carbondale, CO 81623
Carbondale NeighborhoodEstimated Value: $1,978,000 - $2,987,000
5
Beds
5
Baths
4,496
Sq Ft
$570/Sq Ft
Est. Value
About This Home
This home is located at 644 N Bridge Dr, Carbondale, CO 81623 and is currently estimated at $2,561,495, approximately $569 per square foot. 644 N Bridge Dr is a home located in Garfield County with nearby schools including Ross Montessori School, Carbondale Community Charter School, and Colorado Rocky Mountain School.
Ownership History
Date
Name
Owned For
Owner Type
Purchase Details
Closed on
Nov 3, 2006
Sold by
Foulkrod John F
Bought by
Rangel Fred R and Rangel Patricia R
Current Estimated Value
Home Financials for this Owner
Home Financials are based on the most recent Mortgage that was taken out on this home.
Original Mortgage
$660,000
Outstanding Balance
$393,897
Interest Rate
6.37%
Mortgage Type
Purchase Money Mortgage
Estimated Equity
$2,167,598
Purchase Details
Closed on
May 18, 2005
Sold by
Crystal River Lp
Bought by
Foulkrod John F
Purchase Details
Closed on
Jul 19, 1999
Sold by
Crystal River Limited Part
Bought by
Aspen Valley Cont Co
Create a Home Valuation Report for This Property
The Home Valuation Report is an in-depth analysis detailing your home's value as well as a comparison with similar homes in the area
Home Values in the Area
Average Home Value in this Area
Purchase History
| Date | Buyer | Sale Price | Title Company |
|---|---|---|---|
| Rangel Fred R | $825,000 | Land Title Guarantee Company | |
| Foulkrod John F | $86,400 | Land Title Guarantee Company | |
| Aspen Valley Cont Co | $500,600 | -- |
Source: Public Records
Mortgage History
| Date | Status | Borrower | Loan Amount |
|---|---|---|---|
| Open | Rangel Fred R | $660,000 |
Source: Public Records
Tax History Compared to Growth
Tax History
| Year | Tax Paid | Tax Assessment Tax Assessment Total Assessment is a certain percentage of the fair market value that is determined by local assessors to be the total taxable value of land and additions on the property. | Land | Improvement |
|---|---|---|---|---|
| 2024 | $8,906 | $117,120 | $22,410 | $94,710 |
| 2023 | $8,906 | $117,120 | $22,410 | $94,710 |
| 2022 | $5,987 | $75,550 | $6,950 | $68,600 |
| 2021 | $6,070 | $77,720 | $7,150 | $70,570 |
| 2020 | $5,155 | $70,180 | $7,870 | $62,310 |
| 2019 | $5,197 | $70,180 | $7,870 | $62,310 |
| 2018 | $4,752 | $65,530 | $7,200 | $58,330 |
| 2017 | $4,973 | $65,530 | $7,200 | $58,330 |
| 2016 | $5,032 | $65,120 | $5,570 | $59,550 |
| 2015 | $5,102 | $65,120 | $5,570 | $59,550 |
| 2014 | -- | $50,930 | $3,740 | $47,190 |
Source: Public Records
Map
Nearby Homes
- 428 Jewels Ln
- 1555 Colorado 133
- 1188 Cr 106
- 1185 Heritage Dr
- 3580 Crystal Bridge Dr
- 584 Grace Dr
- 3600 Crystal Bridge Dr
- 1229 Heritage Dr
- 621 S 2nd St Unit U
- 3898 Crystal Bridge Dr
- 3871 Crystal Bridge Dr
- 349 Crystal Cir
- 3859 Crystal Bridge Dr
- 74 Ferguson Dr
- 22 Heritage Ct
- 718 Main St Unit 718
- 202 Euclid Ave
- 0 Maroon Dr Unit 190601
- 89 Meadow Wood Dr Unit C-2
- 155 Main St
- 640 N Bridge Dr
- 650 N Bridge Dr
- 654 N Bridge Dr
- 457 Settlement Ln
- 671 N Bridge Dr
- TBD N Bridge Dr Unit Sopris View PUD - Lo
- TBD N Bridge Dr
- 453 Settlement Ln
- 645 N Bridge Dr
- 641 N Bridge Dr
- 630 N Bridge Dr
- 641 N North Bridge Dr
- 649 N Bridge Dr
- 660 N Bridge Dr
- 637 N Bridge Dr
- 465 Settlement Ln
- 449 Settlement Ln
- 653 N Bridge
- 633 N Bridge Dr
- TBD N North Bridge Dr