Estimated Value: $288,803 - $307,000
3
Beds
2
Baths
1,555
Sq Ft
$190/Sq Ft
Est. Value
About This Home
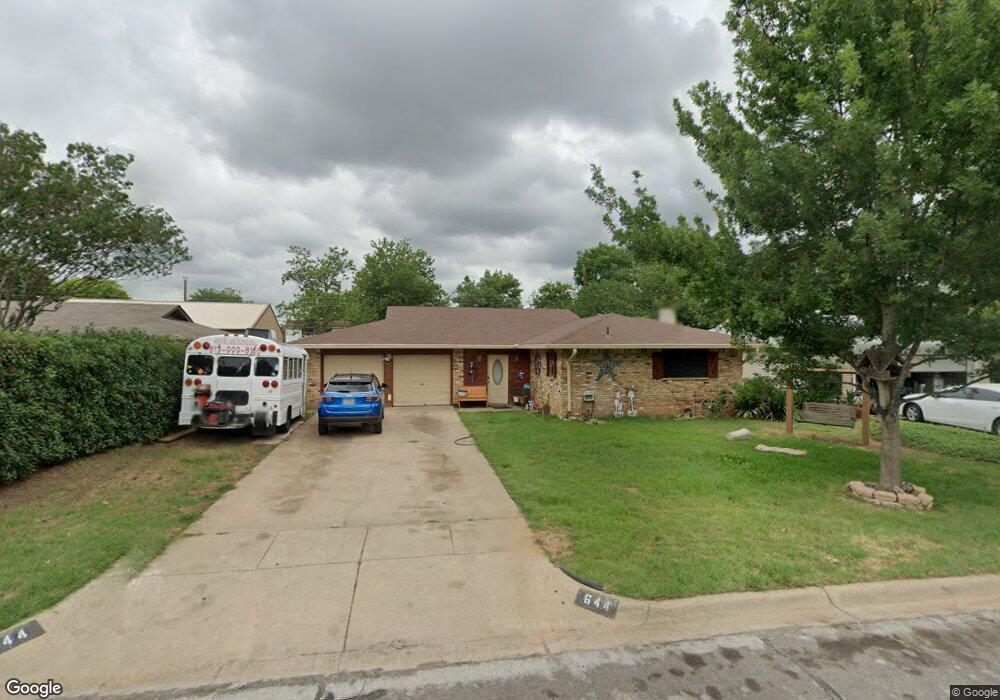
This home is located at 644 Oak Dr, Hurst, TX 76053 and is currently estimated at $294,701, approximately $189 per square foot. 644 Oak Dr is a home located in Tarrant County with nearby schools including West Hurst Elementary School, Hurst J High School, and L.D. Bell High School.
Ownership History
Date
Name
Owned For
Owner Type
Purchase Details
Closed on
Nov 23, 2010
Sold by
Faragini Diane L
Bought by
Grayson Billie J
Current Estimated Value
Home Financials for this Owner
Home Financials are based on the most recent Mortgage that was taken out on this home.
Original Mortgage
$78,375
Outstanding Balance
$51,446
Interest Rate
4.17%
Mortgage Type
New Conventional
Estimated Equity
$243,255
Purchase Details
Closed on
Feb 21, 2007
Sold by
Fontenot Grace
Bought by
Faragini Diane L
Home Financials for this Owner
Home Financials are based on the most recent Mortgage that was taken out on this home.
Original Mortgage
$109,500
Interest Rate
6.17%
Mortgage Type
Purchase Money Mortgage
Purchase Details
Closed on
Jan 26, 1994
Sold by
Fontenot Ixon and Fontenot Grace
Bought by
Fontenot Ixon and Fontenot Grace
Create a Home Valuation Report for This Property
The Home Valuation Report is an in-depth analysis detailing your home's value as well as a comparison with similar homes in the area
Home Values in the Area
Average Home Value in this Area
Purchase History
| Date | Buyer | Sale Price | Title Company |
|---|---|---|---|
| Grayson Billie J | -- | Capital Title | |
| Faragini Diane L | -- | None Available | |
| Fontenot Ixon | -- | -- |
Source: Public Records
Mortgage History
| Date | Status | Borrower | Loan Amount |
|---|---|---|---|
| Open | Grayson Billie J | $78,375 | |
| Previous Owner | Faragini Diane L | $109,500 |
Source: Public Records
Tax History
| Year | Tax Paid | Tax Assessment Tax Assessment Total Assessment is a certain percentage of the fair market value that is determined by local assessors to be the total taxable value of land and additions on the property. | Land | Improvement |
|---|---|---|---|---|
| 2025 | $5,480 | $268,315 | $60,000 | $208,315 |
| 2024 | $5,480 | $268,315 | $60,000 | $208,315 |
| 2023 | $5,439 | $271,509 | $30,000 | $241,509 |
| 2022 | $5,209 | $226,230 | $30,000 | $196,230 |
| 2021 | $4,898 | $203,078 | $30,000 | $173,078 |
| 2020 | $3,980 | $165,430 | $30,000 | $135,430 |
| 2019 | $4,164 | $170,133 | $30,000 | $140,133 |
| 2018 | $3,809 | $155,617 | $18,000 | $137,617 |
| 2017 | $3,743 | $147,920 | $18,000 | $129,920 |
| 2016 | $3,307 | $130,665 | $18,000 | $112,665 |
| 2015 | $2,439 | $93,000 | $15,000 | $78,000 |
| 2014 | $2,439 | $93,000 | $15,000 | $78,000 |
Source: Public Records
Map
Nearby Homes
- 712 Pine St
- 813 Chase Cir
- 756 Briarwood Ln
- 758 Briarwood Ln
- 709 Hurstview Dr
- 624 Forest Ln
- 608 W Redbud Dr
- 729 W Cheryl Ave
- 512 Shadowbrook Ln
- 416 Simmons Dr
- 408 Simmons Dr
- 528 Buena Vista Dr
- 852 W Redbud Dr
- 1112 Karla Dr
- 231 Elm St
- 540 Billie Ruth Ln
- 324 Moore Creek Rd
- 637 Post Oak Dr
- 512 Billie Ruth Ln
- 209 W Cedar St
Your Personal Tour Guide
Ask me questions while you tour the home.