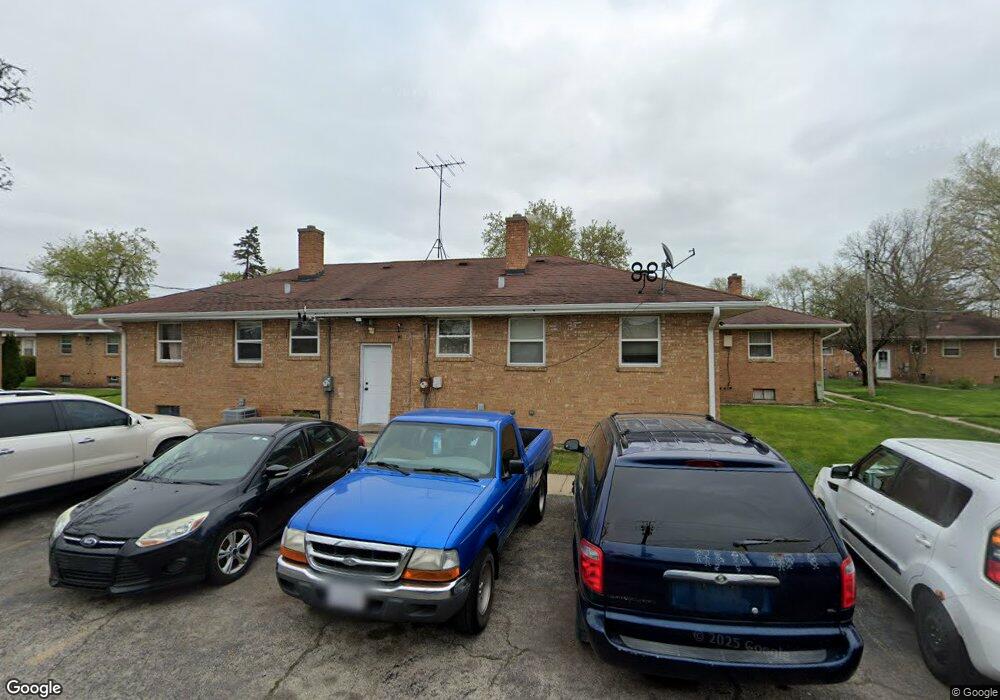
644 Pickus Ct Unit 6 Waukegan, IL 60085
Estimated Value: $172,000 - $248,000
2
Beds
2
Baths
1,300
Sq Ft
$168/Sq Ft
Est. Value
About This Home
This home is located at 644 Pickus Ct Unit 6, Waukegan, IL 60085 and is currently estimated at $217,815, approximately $167 per square foot. 644 Pickus Ct Unit 6 is a home located in Lake County with nearby schools including Glen Flora Elementary School, Edith M Smith Middle School, and Waukegan High School.
Ownership History
Date
Name
Owned For
Owner Type
Purchase Details
Closed on
Apr 20, 2018
Sold by
Bhavek Llc
Bought by
Nda Realty Llc
Current Estimated Value
Home Financials for this Owner
Home Financials are based on the most recent Mortgage that was taken out on this home.
Original Mortgage
$546,000
Interest Rate
4.75%
Mortgage Type
Commercial
Purchase Details
Closed on
Mar 25, 2015
Sold by
Md Properties Llc
Bought by
Bhavek Llc
Purchase Details
Closed on
Apr 13, 2011
Sold by
Pickus Court Buildings Inc
Bought by
Md Properties Llc
Home Financials for this Owner
Home Financials are based on the most recent Mortgage that was taken out on this home.
Original Mortgage
$462,000
Interest Rate
4.92%
Mortgage Type
Commercial
Purchase Details
Closed on
Jan 1, 2009
Sold by
Sun Kim Chong Sung and Sun Kim Kyong
Bought by
Pickus Court Buildings Inc
Create a Home Valuation Report for This Property
The Home Valuation Report is an in-depth analysis detailing your home's value as well as a comparison with similar homes in the area
Home Values in the Area
Average Home Value in this Area
Purchase History
| Date | Buyer | Sale Price | Title Company |
|---|---|---|---|
| Nda Realty Llc | $728,000 | First American Title | |
| Bhavek Llc | $576,000 | Chicago Title Insurance Co | |
| Md Properties Llc | $660,000 | Multiple | |
| Pickus Court Buildings Inc | -- | None Available |
Source: Public Records
Mortgage History
| Date | Status | Borrower | Loan Amount |
|---|---|---|---|
| Closed | Nda Realty Llc | $546,000 | |
| Previous Owner | Md Properties Llc | $462,000 |
Source: Public Records
Tax History Compared to Growth
Tax History
| Year | Tax Paid | Tax Assessment Tax Assessment Total Assessment is a certain percentage of the fair market value that is determined by local assessors to be the total taxable value of land and additions on the property. | Land | Improvement |
|---|---|---|---|---|
| 2024 | $4,374 | $51,489 | $7,152 | $44,337 |
| 2023 | $3,536 | $46,390 | $6,404 | $39,986 |
| 2022 | $3,536 | $36,169 | $5,483 | $30,686 |
| 2021 | $3,738 | $35,853 | $5,435 | $30,418 |
| 2020 | $3,786 | $33,401 | $5,063 | $28,338 |
| 2019 | $3,810 | $30,606 | $4,639 | $25,967 |
| 2018 | $4,509 | $34,876 | $5,909 | $28,967 |
| 2017 | $4,389 | $30,856 | $5,228 | $25,628 |
| 2016 | $4,143 | $26,813 | $4,543 | $22,270 |
| 2015 | $4,054 | $28,029 | $4,066 | $23,963 |
| 2014 | $2,762 | $16,328 | $3,469 | $12,859 |
| 2012 | $3,424 | $17,690 | $3,759 | $13,931 |
Source: Public Records
Map
Nearby Homes
- 1109 Massena Ave
- 824 N Butrick St
- 917 N Linden Ave
- 509 N Butrick St
- 620 N Poplar St
- 1000 Pine St
- 702 Franklin St
- 522 N Poplar St
- 511 Chestnut St
- 428 N Poplar St
- 918 N Ash St
- 1105 Woodlawn Cir
- 968 Judge Ave
- 452 North Ave
- 1110 N Ash St
- 1117 Judge Ave
- 1122 N Ash St
- 1023 N Elmwood Ave
- 1504 W Glen Flora Ave
- 1213 Grand Ave
- 708 N Linden Ave
- 706 N Linden Ave Unit 706
- 704 N Linden Ave Unit 704
- 704 N Linden Ave Unit 716
- 650 Pickus Ct
- 710 N Linden Ave
- 700 N Linden Ave Unit 700
- 700 N Linden Ave
- 1112 Porter St
- 702 N Linden Ave Unit 702
- 716 N Linden Ave Unit 716
- 718 N Linden Ave
- 720 N Linden Ave
- 1021 Edwards St
- 1111 Porter St
- 707 Pine St
- 1110 Porter St