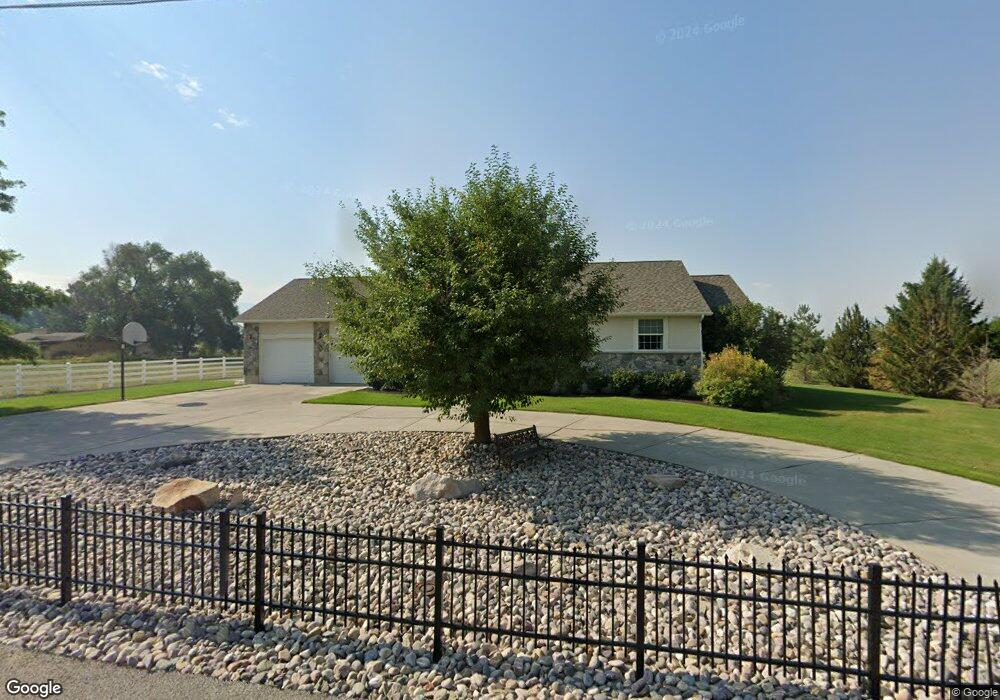
644 W 100 S Smithfield, UT 84335
Estimated Value: $663,000 - $757,000
Studio
--
Bath
2,133
Sq Ft
$333/Sq Ft
Est. Value
About This Home
This home is located at 644 W 100 S, Smithfield, UT 84335 and is currently estimated at $711,181, approximately $333 per square foot. 644 W 100 S is a home with nearby schools including Birch Creek School, Cedar Ridge School, and North Cache Middle School.
Ownership History
Date
Name
Owned For
Owner Type
Purchase Details
Closed on
May 6, 2019
Sold by
Johnson Jeffrey J and Johnson Alena C
Bought by
The Jeffrey & Alena Johnson Family Trust
Current Estimated Value
Purchase Details
Closed on
Jan 9, 2015
Sold by
Johnson Jeffrey J and Johnson Alena Collier
Bought by
Johnson Jeffrey J and Johnson Alena C
Home Financials for this Owner
Home Financials are based on the most recent Mortgage that was taken out on this home.
Original Mortgage
$177,000
Interest Rate
3.82%
Mortgage Type
New Conventional
Purchase Details
Closed on
Dec 10, 2001
Sold by
Johnson Jeffrey Jay and Johnson Alena Collier
Bought by
Johnson Jeffrey J and Johnson Alena Collier
Home Financials for this Owner
Home Financials are based on the most recent Mortgage that was taken out on this home.
Original Mortgage
$173,700
Interest Rate
6.67%
Create a Home Valuation Report for This Property
The Home Valuation Report is an in-depth analysis detailing your home's value as well as a comparison with similar homes in the area
Home Values in the Area
Average Home Value in this Area
Purchase History
| Date | Buyer | Sale Price | Title Company |
|---|---|---|---|
| The Jeffrey & Alena Johnson Family Trust | -- | None Available | |
| Johnson Jeffrey J | -- | Pinnacle Title Ins Agency | |
| Johnson Jeffrey J | -- | Northern Title Company |
Source: Public Records
Mortgage History
| Date | Status | Borrower | Loan Amount |
|---|---|---|---|
| Closed | Johnson Jeffrey J | $177,000 | |
| Closed | Johnson Jeffrey J | $173,700 |
Source: Public Records
Tax History
| Year | Tax Paid | Tax Assessment Tax Assessment Total Assessment is a certain percentage of the fair market value that is determined by local assessors to be the total taxable value of land and additions on the property. | Land | Improvement |
|---|---|---|---|---|
| 2025 | $3,309 | $442,990 | $0 | $0 |
| 2024 | $3,459 | $434,330 | $0 | $0 |
| 2023 | $2,848 | $338,300 | $0 | $0 |
| 2022 | $2,895 | $338,300 | $0 | $0 |
| 2021 | $2,917 | $501,160 | $124,000 | $377,160 |
| 2020 | $2,713 | $432,154 | $124,000 | $308,154 |
| 2019 | $2,574 | $393,904 | $85,750 | $308,154 |
| 2018 | $2,400 | $353,710 | $85,750 | $267,960 |
| 2017 | $2,257 | $189,245 | $0 | $0 |
| 2016 | $2,296 | $189,245 | $0 | $0 |
| 2015 | $2,119 | $173,950 | $0 | $0 |
| 2014 | $2,078 | $173,985 | $0 | $0 |
| 2013 | -- | $173,985 | $0 | $0 |
Source: Public Records
Map
Nearby Homes
Your Personal Tour Guide
Ask me questions while you tour the home.