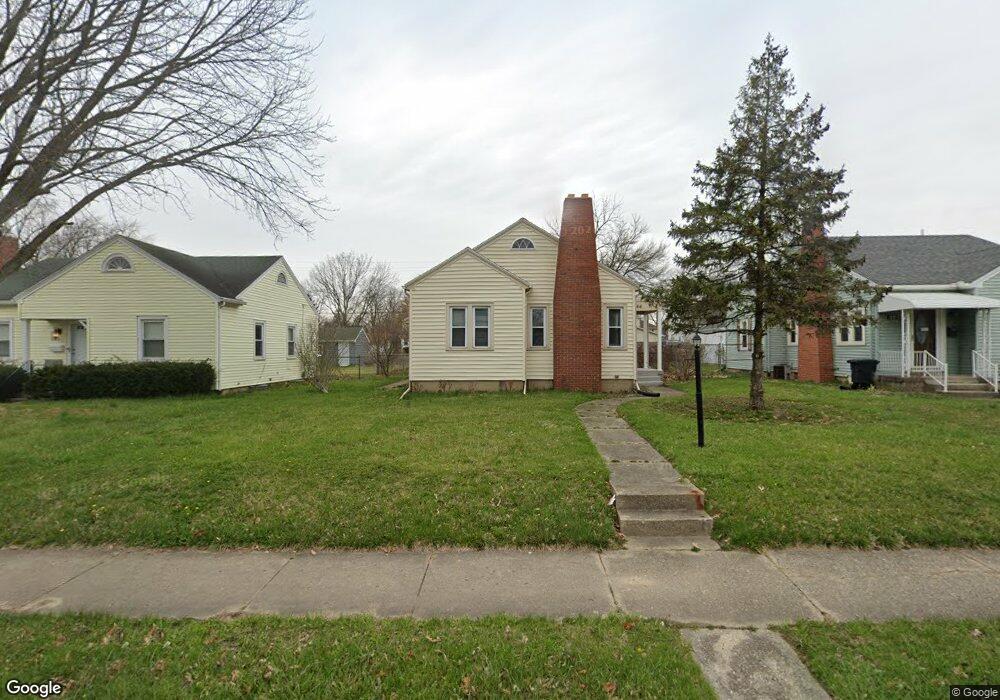
644 W 1st St Springfield, OH 45504
Estimated Value: $154,000 - $166,000
2
Beds
1
Bath
902
Sq Ft
$176/Sq Ft
Est. Value
About This Home
This home is located at 644 W 1st St, Springfield, OH 45504 and is currently estimated at $159,168, approximately $176 per square foot. 644 W 1st St is a home located in Clark County with nearby schools including Snowhill Elementary School, Roosevelt Middle School, and Springfield High School.
Ownership History
Date
Name
Owned For
Owner Type
Purchase Details
Closed on
May 25, 2022
Sold by
Fisher and Dixie
Bought by
Halpin Emily J and Elliott Andrew Warren
Current Estimated Value
Home Financials for this Owner
Home Financials are based on the most recent Mortgage that was taken out on this home.
Original Mortgage
$113,870
Outstanding Balance
$108,174
Interest Rate
5.25%
Mortgage Type
FHA
Estimated Equity
$50,994
Purchase Details
Closed on
Sep 15, 2021
Sold by
Hamilton Michael R and Hamilton Cheryl L
Bought by
Fisher Monty and Fisher Dixie
Purchase Details
Closed on
Jun 5, 2014
Sold by
Citimortgage Inc
Bought by
Hamilton Michael R and Hamilton Cheryl L
Purchase Details
Closed on
Nov 15, 2013
Sold by
Lewis Kevin R
Bought by
Citimortgage Inc
Purchase Details
Closed on
Apr 20, 1987
Sold by
Lewis Dorothy D
Bought by
Lewis Kevin R
Purchase Details
Closed on
May 19, 1986
Create a Home Valuation Report for This Property
The Home Valuation Report is an in-depth analysis detailing your home's value as well as a comparison with similar homes in the area
Home Values in the Area
Average Home Value in this Area
Purchase History
| Date | Buyer | Sale Price | Title Company |
|---|---|---|---|
| Halpin Emily J | $118,000 | Cole Acton Harmon Dunn | |
| Fisher Monty | $42,000 | Team Ttl & Closing Svcs Llc | |
| Hamilton Michael R | $35,000 | Servicelink | |
| Citimortgage Inc | $45,000 | Attorney | |
| Lewis Kevin R | $20,000 | -- | |
| -- | $37,500 | -- |
Source: Public Records
Mortgage History
| Date | Status | Borrower | Loan Amount |
|---|---|---|---|
| Open | Halpin Emily J | $113,870 |
Source: Public Records
Tax History Compared to Growth
Tax History
| Year | Tax Paid | Tax Assessment Tax Assessment Total Assessment is a certain percentage of the fair market value that is determined by local assessors to be the total taxable value of land and additions on the property. | Land | Improvement |
|---|---|---|---|---|
| 2024 | $1,637 | $33,150 | $6,880 | $26,270 |
| 2023 | $1,637 | $33,150 | $6,880 | $26,270 |
| 2022 | $1,677 | $33,150 | $6,880 | $26,270 |
| 2021 | $1,410 | $25,650 | $5,290 | $20,360 |
| 2020 | $1,413 | $25,650 | $5,290 | $20,360 |
| 2019 | $1,416 | $25,650 | $5,290 | $20,360 |
| 2018 | $830 | $14,000 | $4,600 | $9,400 |
| 2017 | $805 | $26,026 | $4,599 | $21,427 |
| 2016 | $806 | $26,026 | $4,599 | $21,427 |
| 2015 | $2,474 | $26,026 | $4,599 | $21,427 |
| 2014 | $1,586 | $26,026 | $4,599 | $21,427 |
| 2013 | $1,581 | $26,026 | $4,599 | $21,427 |
Source: Public Records
Map
Nearby Homes
- 640 W 1st St
- 650 W 1st St
- 638 W 1st St
- 628 W 1st St
- 1303 Woodland Dr
- 1303 Woodland Rd
- 643 Snowhill Blvd
- 647 Snowhill Blvd
- 633 Snowhill Blvd
- 706 W 1st St
- 627 Snowhill Blvd
- 701 Snowhill Blvd
- 710 W 1st St
- 620 W 1st St
- 623 Snowhill Blvd
- 725 Snowhill Blvd
- 617 Snowhill Blvd
- 735 Snowhill Blvd
- 720 W 1st St
- 1307 Saint Paris Pike