Estimated Value: $523,000 - $580,000
6
Beds
3
Baths
3,041
Sq Ft
$180/Sq Ft
Est. Value
About This Home
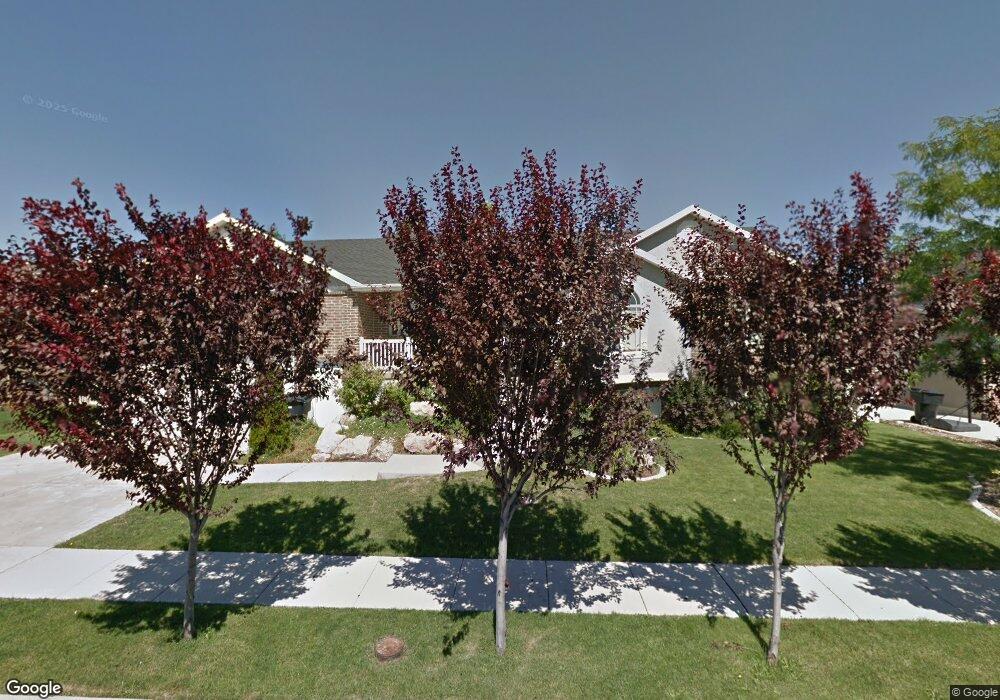
This home is located at 644 W 3600 S, Ogden, UT 84405 and is currently estimated at $547,826, approximately $180 per square foot. 644 W 3600 S is a home located in Weber County with nearby schools including Riverdale School, T.H. Bell Junior High School, and Bonneville High School.
Ownership History
Date
Name
Owned For
Owner Type
Purchase Details
Closed on
Jun 17, 2011
Sold by
Fuoss Nicholas W
Bought by
Fuoss Nicholas W and Goodrich Kami
Current Estimated Value
Home Financials for this Owner
Home Financials are based on the most recent Mortgage that was taken out on this home.
Original Mortgage
$242,500
Outstanding Balance
$167,174
Interest Rate
4.63%
Mortgage Type
VA
Estimated Equity
$380,652
Purchase Details
Closed on
Jun 28, 2010
Sold by
Citte Trent
Bought by
Citte Properties Llc
Purchase Details
Closed on
Oct 25, 2004
Sold by
Vankomen Robert H
Bought by
Citte Trent
Home Financials for this Owner
Home Financials are based on the most recent Mortgage that was taken out on this home.
Original Mortgage
$165,300
Interest Rate
5.82%
Mortgage Type
Purchase Money Mortgage
Create a Home Valuation Report for This Property
The Home Valuation Report is an in-depth analysis detailing your home's value as well as a comparison with similar homes in the area
Home Values in the Area
Average Home Value in this Area
Purchase History
| Date | Buyer | Sale Price | Title Company |
|---|---|---|---|
| Fuoss Nicholas W | -- | Lincoln Title Ins Agency | |
| Fuoss Nicholas W | -- | Lincoln Title Ins Agency | |
| Citte Properties Llc | -- | Hickman Land Title Company | |
| Citte Trent | -- | Bonneville Title Company Cle |
Source: Public Records
Mortgage History
| Date | Status | Borrower | Loan Amount |
|---|---|---|---|
| Open | Fuoss Nicholas W | $242,500 | |
| Previous Owner | Citte Trent | $165,300 |
Source: Public Records
Tax History Compared to Growth
Tax History
| Year | Tax Paid | Tax Assessment Tax Assessment Total Assessment is a certain percentage of the fair market value that is determined by local assessors to be the total taxable value of land and additions on the property. | Land | Improvement |
|---|---|---|---|---|
| 2025 | $2,741 | $507,585 | $165,005 | $342,580 |
| 2024 | $2,741 | $272,799 | $90,752 | $182,047 |
| 2023 | $2,635 | $260,150 | $90,754 | $169,396 |
| 2022 | $2,896 | $291,500 | $90,754 | $200,746 |
| 2021 | $2,265 | $417,000 | $115,012 | $301,988 |
| 2020 | $2,042 | $347,000 | $69,976 | $277,024 |
| 2019 | $2,101 | $338,000 | $65,038 | $272,962 |
| 2018 | $2,054 | $316,000 | $65,038 | $250,962 |
| 2017 | $1,927 | $283,000 | $59,979 | $223,021 |
| 2016 | $1,741 | $139,026 | $27,229 | $111,797 |
| 2015 | $1,627 | $127,034 | $25,610 | $101,424 |
| 2014 | $1,646 | $127,034 | $25,610 | $101,424 |
Source: Public Records
Map
Nearby Homes
- 641 W 3550 S
- 620 W 3600 S
- 629 W 3700 S
- 3746 Parker Dr
- 3927 S Lamplighter Way
- 3937 S Lamplighter Way Unit 23
- 621 Coachman Way
- 567 W 3950 S
- 871 W 3875 S
- 3975 Westwind Ct
- 4015 Meadow Wood Dr
- 780 W 4075 S
- 902 W 4200 S
- 644 W 4300 S
- 4290 S 800 W
- 4265 S 950 W
- 1075 W 4175 S
- 751 W 4350 S
- 154 E Harris St
- 4375 S Weber River Dr Unit 66
- 668 W 3600 S
- 668 W 3600 S Unit LOT 24
- 642 W 3600 S
- 669 W 3550 S
- 653 W 3550 S
- 643 W 3600 S
- 639 W 3600 S
- 3576 S 700 W
- 3473 W 3600 S
- 638 W 3600 S
- 641 W 3550 S Unit 89
- 3590 S 700 W
- 640 W 3550 S
- 651 W 3600 S
- 651 W 3600 S Unit LOT21
- 3552 S 700 W
- 679 W 3600 S Unit LOT 20
- 627 W 3550 S
- 3544 S 700 W
- 635 W 3600 S