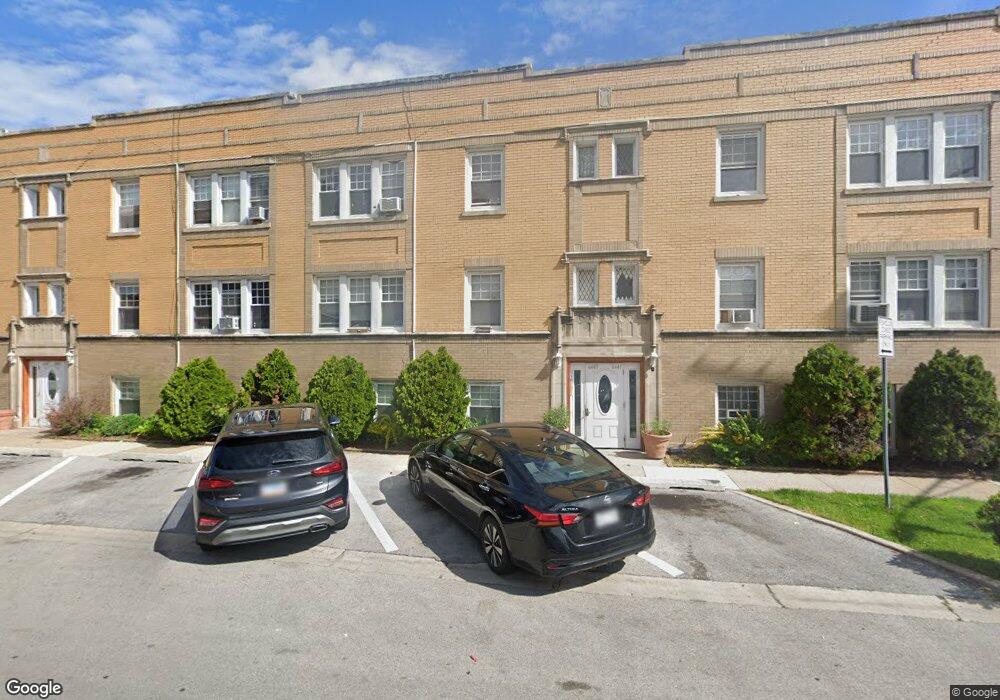
6443 18th St Unit 7 Berwyn, IL 60402
Estimated Value: $124,000 - $157,827
2
Beds
1
Bath
900
Sq Ft
$158/Sq Ft
Est. Value
About This Home
This home is located at 6443 18th St Unit 7, Berwyn, IL 60402 and is currently estimated at $141,957, approximately $157 per square foot. 6443 18th St Unit 7 is a home located in Cook County with nearby schools including Prairie Oak School, Lincoln Middle School, and J Sterling Morton West High School.
Ownership History
Date
Name
Owned For
Owner Type
Purchase Details
Closed on
Sep 24, 2004
Sold by
Mcculley Lana
Bought by
Alexander Deidre
Current Estimated Value
Home Financials for this Owner
Home Financials are based on the most recent Mortgage that was taken out on this home.
Original Mortgage
$110,400
Outstanding Balance
$51,834
Interest Rate
5%
Mortgage Type
Purchase Money Mortgage
Estimated Equity
$90,123
Purchase Details
Closed on
Jan 8, 2002
Sold by
Lasalle Bank National Assn
Bought by
Oseguera Rogelio
Home Financials for this Owner
Home Financials are based on the most recent Mortgage that was taken out on this home.
Original Mortgage
$94,950
Interest Rate
7.16%
Mortgage Type
FHA
Purchase Details
Closed on
Jul 21, 2001
Sold by
Lasalle Bank National Assn
Bought by
Mcculley Lana
Home Financials for this Owner
Home Financials are based on the most recent Mortgage that was taken out on this home.
Original Mortgage
$73,752
Interest Rate
7.15%
Mortgage Type
Purchase Money Mortgage
Create a Home Valuation Report for This Property
The Home Valuation Report is an in-depth analysis detailing your home's value as well as a comparison with similar homes in the area
Home Values in the Area
Average Home Value in this Area
Purchase History
| Date | Buyer | Sale Price | Title Company |
|---|---|---|---|
| Alexander Deidre | $138,000 | -- | |
| Oseguera Rogelio | $98,000 | -- | |
| Mcculley Lana | $92,500 | -- |
Source: Public Records
Mortgage History
| Date | Status | Borrower | Loan Amount |
|---|---|---|---|
| Open | Alexander Deidre | $110,400 | |
| Previous Owner | Oseguera Rogelio | $94,950 | |
| Previous Owner | Mcculley Lana | $73,752 | |
| Closed | Alexander Deidre | $13,800 |
Source: Public Records
Tax History Compared to Growth
Tax History
| Year | Tax Paid | Tax Assessment Tax Assessment Total Assessment is a certain percentage of the fair market value that is determined by local assessors to be the total taxable value of land and additions on the property. | Land | Improvement |
|---|---|---|---|---|
| 2024 | $2,428 | $11,040 | $832 | $10,208 |
| 2023 | $1,491 | $11,040 | $832 | $10,208 |
| 2022 | $1,491 | $7,140 | $748 | $6,392 |
| 2021 | $1,454 | $7,140 | $748 | $6,392 |
| 2020 | $1,501 | $7,140 | $748 | $6,392 |
| 2019 | $1,975 | $8,217 | $679 | $7,538 |
| 2018 | $1,895 | $8,217 | $679 | $7,538 |
| 2017 | $1,859 | $8,217 | $679 | $7,538 |
| 2016 | $2,100 | $7,463 | $568 | $6,895 |
| 2015 | $2,009 | $7,463 | $568 | $6,895 |
| 2014 | $1,975 | $7,463 | $568 | $6,895 |
| 2013 | $2,343 | $9,161 | $568 | $8,593 |
Source: Public Records
Map
Nearby Homes
- 1644 Gunderson Ave
- 1820 Gunderson Ave
- 1805 Elmwood Ave
- 1842 Elmwood Ave
- 1631 Clarence Ave
- 1521 Gunderson Ave
- 1855 Ridgeland Ave
- 1932 East Ave
- 1435 Gunderson Ave
- 2102 Gunderson Ave
- 1523 Cuyler Ave
- 1429 Gunderson Ave
- 2107 East Ave
- 1440 Cuyler Ave
- 1938 Highland Ave
- 1833 Oak Park Ave
- 1413 Cuyler Ave
- 7133 W 16th St
- 1325 Gunderson Ave
- 1426 Harvey Ave
- 6443 18th St Unit 5
- 6443 18th St Unit 2
- 6443 18th St Unit 1
- 6445 18th St Unit 4
- 6447 18th St Unit 9
- 6445 18th St Unit 10
- 6447 18th St Unit 3
- 6447 18th St Unit 1
- 6445 18th St Unit 2
- 6447 18th St Unit G
- 1645 Gunderson Ave
- 1645 Gunderson Ave Unit 2C
- 1645 Gunderson Ave Unit 1F
- 6446 18th St
- 6446 18th St Unit 2W
- 6446 18th St Unit 2E
- 6446 18th St Unit 1E
- 6446 18th St Unit 1W
- 6446 18th St Unit G
- 6441 18th St Unit 8