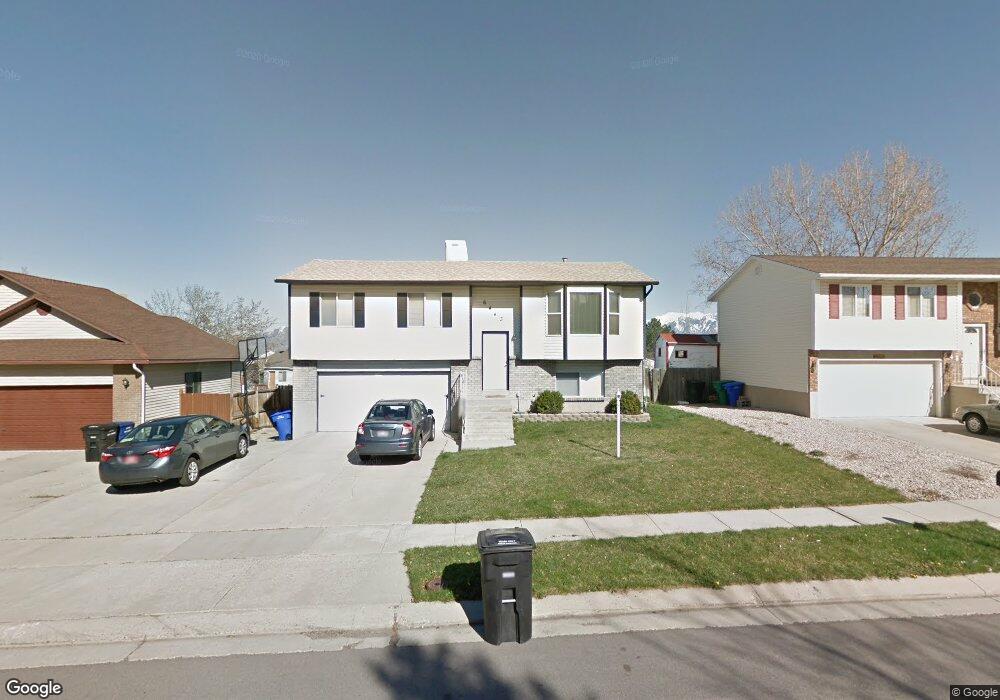
6443 Lotus Way West Jordan, UT 84081
Oquirrh NeighborhoodEstimated Value: $445,000 - $466,000
4
Beds
1
Bath
1,544
Sq Ft
$296/Sq Ft
Est. Value
About This Home
This home is located at 6443 Lotus Way, West Jordan, UT 84081 and is currently estimated at $457,051, approximately $296 per square foot. 6443 Lotus Way is a home located in Salt Lake County with nearby schools including Jim Bridger Elementary School, Thomas Jefferson Jr High School, and Kearns High School.
Ownership History
Date
Name
Owned For
Owner Type
Purchase Details
Closed on
Oct 27, 2014
Sold by
Zupan G Michael and Zupan Carolynne
Bought by
Fivas Matthew T
Current Estimated Value
Home Financials for this Owner
Home Financials are based on the most recent Mortgage that was taken out on this home.
Original Mortgage
$171,000
Outstanding Balance
$131,951
Interest Rate
4.2%
Mortgage Type
New Conventional
Estimated Equity
$325,100
Purchase Details
Closed on
Mar 25, 2002
Sold by
Gonzales L David and Gonzales Brook H
Bought by
Kraft James C and Kraft Kimberly D
Home Financials for this Owner
Home Financials are based on the most recent Mortgage that was taken out on this home.
Original Mortgage
$127,991
Interest Rate
6.84%
Mortgage Type
FHA
Purchase Details
Closed on
Apr 29, 1994
Sold by
Mccann Gerald J and Mccann Tamara K
Bought by
Gonzales L David and Gonzales Brook H
Home Financials for this Owner
Home Financials are based on the most recent Mortgage that was taken out on this home.
Original Mortgage
$64,928
Interest Rate
7.79%
Mortgage Type
FHA
Create a Home Valuation Report for This Property
The Home Valuation Report is an in-depth analysis detailing your home's value as well as a comparison with similar homes in the area
Home Values in the Area
Average Home Value in this Area
Purchase History
| Date | Buyer | Sale Price | Title Company |
|---|---|---|---|
| Fivas Matthew T | -- | Preferred Title & Escrow Ins | |
| Kraft James C | -- | Superior Title Company | |
| Gonzales L David | -- | -- |
Source: Public Records
Mortgage History
| Date | Status | Borrower | Loan Amount |
|---|---|---|---|
| Open | Fivas Matthew T | $171,000 | |
| Previous Owner | Kraft James C | $127,991 | |
| Previous Owner | Gonzales L David | $64,928 |
Source: Public Records
Tax History Compared to Growth
Tax History
| Year | Tax Paid | Tax Assessment Tax Assessment Total Assessment is a certain percentage of the fair market value that is determined by local assessors to be the total taxable value of land and additions on the property. | Land | Improvement |
|---|---|---|---|---|
| 2025 | $2,497 | $417,200 | $100,400 | $316,800 |
| 2024 | $2,497 | $393,600 | $94,700 | $298,900 |
| 2023 | $2,458 | $369,100 | $91,000 | $278,100 |
| 2022 | $2,353 | $359,300 | $89,300 | $270,000 |
| 2021 | $2,151 | $292,000 | $68,700 | $223,300 |
| 2020 | $1,973 | $253,200 | $68,700 | $184,500 |
| 2019 | $1,937 | $241,400 | $64,800 | $176,600 |
| 2018 | $1,843 | $221,800 | $64,800 | $157,000 |
| 2017 | $1,646 | $208,500 | $64,800 | $143,700 |
| 2016 | $1,525 | $191,900 | $64,800 | $127,100 |
| 2015 | $1,430 | $167,500 | $62,000 | $105,500 |
| 2014 | $1,404 | $161,300 | $60,100 | $101,200 |
Source: Public Records
Map
Nearby Homes
- 6489 S Daffodil Way
- 5557 W Joshua Cir
- 5382 W Northlilac Ave
- 5732 W Moon Crest Ct
- 6739 S Sol Rise Dr
- 6721 Adventure Way
- 5627 Walnut Ridge Cir
- 5352 Cassatt Cir
- 6568 S 5180 W
- 5281 Saguaro Dr
- 5581 Bluevail Ct
- 6698 Early Dawn Dr
- 5466 Ticklegrass Rd
- 5183 W Cadenza Dr
- 6149 Trowbridge Way
- 6839 S Cyclamen Dr
- 6157 S Impressions Dr
- 6853 Mullien Dr Unit 5420
- 5285 Ridge Flower Way
- 5275 Ridge Flower Way
- 6443 S Lotus Way
- 6453 S Lotus Way
- 6453 Lotus Way
- 6435 Lotus Way
- 5501 W Cyclamen Cove
- 5501 Cyclamen Cove
- 5499 W Cyclamen Cove
- 5500 Cyclamen Cove
- 5499 Cyclamen Cove
- 6461 S Lotus Way
- 6425 Lotus Way
- 5580 Cornflower Cir
- 5498 W Cyclamen Cove
- 5543 Snapdragon Cove
- 5497 Cyclamen Cove
- 5498 Cyclamen Cove
- 6428 Lotus Way
- 5496 Cyclamen Cove
- 6428 S Lotus Way
- 5510 W Lilac Ave