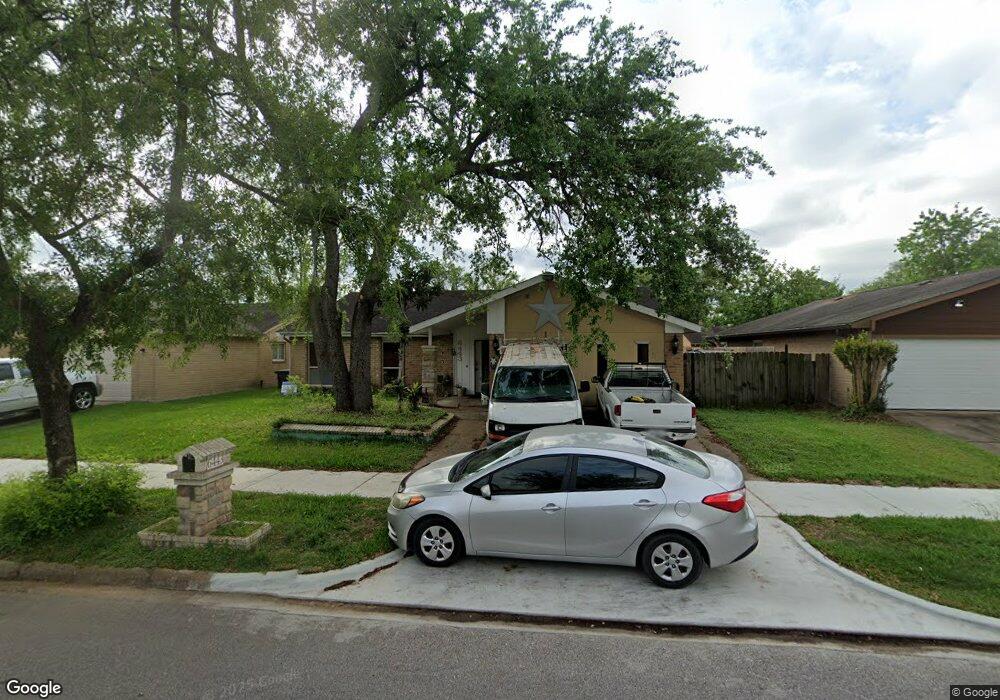
6443 W Fuqua Dr Missouri City, TX 77489
Fort Bend Houston NeighborhoodEstimated Value: $235,000 - $245,000
3
Beds
2
Baths
2,033
Sq Ft
$117/Sq Ft
Est. Value
About This Home
This home is located at 6443 W Fuqua Dr, Missouri City, TX 77489 and is currently estimated at $238,366, approximately $117 per square foot. 6443 W Fuqua Dr is a home located in Fort Bend County with nearby schools including Briargate Elementary School, Blue Ridge Elementary School, and Christa McAuliffe Middle School.
Ownership History
Date
Name
Owned For
Owner Type
Purchase Details
Closed on
Jun 30, 2006
Sold by
Decruz M Gladis Ramos and Garcia Francisco
Bought by
Lozano Jose J
Current Estimated Value
Home Financials for this Owner
Home Financials are based on the most recent Mortgage that was taken out on this home.
Original Mortgage
$66,400
Outstanding Balance
$39,377
Interest Rate
6.63%
Mortgage Type
Purchase Money Mortgage
Estimated Equity
$198,989
Purchase Details
Closed on
Mar 22, 1997
Sold by
Cruz Jose Maria
Bought by
Decruz M Gladis Ramos
Purchase Details
Closed on
Dec 15, 1995
Sold by
Crook Clifford and Crook Amelia H
Bought by
Cruz Jose Maria and Gladis Ramos Decruz M
Home Financials for this Owner
Home Financials are based on the most recent Mortgage that was taken out on this home.
Original Mortgage
$36,000
Interest Rate
7.4%
Create a Home Valuation Report for This Property
The Home Valuation Report is an in-depth analysis detailing your home's value as well as a comparison with similar homes in the area
Home Values in the Area
Average Home Value in this Area
Purchase History
| Date | Buyer | Sale Price | Title Company |
|---|---|---|---|
| Lozano Jose J | -- | Charter Title Company | |
| Decruz M Gladis Ramos | -- | -- | |
| Cruz Jose Maria | -- | Stewart Title | |
| Lozano Jose J | -- | -- |
Source: Public Records
Mortgage History
| Date | Status | Borrower | Loan Amount |
|---|---|---|---|
| Open | Lozano Jose J | $66,400 | |
| Previous Owner | Lozano Jose J | $36,000 |
Source: Public Records
Tax History Compared to Growth
Tax History
| Year | Tax Paid | Tax Assessment Tax Assessment Total Assessment is a certain percentage of the fair market value that is determined by local assessors to be the total taxable value of land and additions on the property. | Land | Improvement |
|---|---|---|---|---|
| 2025 | $1,738 | $172,299 | $71,500 | $164,628 |
| 2024 | $1,738 | $156,635 | -- | $183,753 |
| 2023 | $1,511 | $142,395 | $0 | $206,216 |
| 2022 | $2,035 | $129,450 | $0 | $200,610 |
| 2021 | $2,605 | $117,680 | $25,000 | $92,680 |
| 2020 | $2,413 | $106,980 | $25,000 | $81,980 |
| 2019 | $2,307 | $97,250 | $20,000 | $77,250 |
| 2018 | $2,098 | $88,410 | $20,000 | $68,410 |
| 2017 | $1,929 | $80,370 | $20,000 | $60,370 |
| 2016 | $1,754 | $73,060 | $20,000 | $53,060 |
| 2015 | $813 | $66,420 | $20,000 | $46,420 |
| 2014 | $847 | $60,380 | $20,000 | $40,380 |
Source: Public Records
Map
Nearby Homes
- 15610 Briar Spring Ct
- 15615 Raven Trail
- 15734 Briargate Ct
- 15770 Chimney Rock Rd
- 15806 Corsair Rd
- 6618 Castleview Ln
- 6619 Indian Lake Dr
- 15318 Corsair Rd
- 6101 Maywood Dr
- 15823 Kueben Ln
- 6814 Indian Falls Dr
- 6734 Indian Lake Dr
- 6626 Roberson St
- 0 Brooklawn Dr Unit 98139376
- 6623 Maczali Dr
- 15950 Chimney Rock Rd
- 6911 Briargate Dr
- 6618 Trigate Dr
- 6918 Thornwild Rd
- 5710 W Ridgecreek Dr
- 6447 W Fuqua Dr
- 6439 W Fuqua Dr
- 15618 Briar Spring Ct
- 6435 W Fuqua Dr
- 15614 Briar Spring Ct
- 6451 W Fuqua Dr
- 15622 Briar Spring Ct
- 15626 Briar Spring Ct
- 6431 W Fuqua Dr
- 15606 Briar Spring Ct
- 15515 Rose Ridge Ct
- 15511 Rose Ridge Ct
- 15603 Rose Ridge Ct
- 6427 W Fuqua Dr
- 15602 Briar Spring Ct
- 15507 Rose Ridge Ct
- 15607 Rose Ridge Ct
- 15619 Briar Spring Ct
- 15615 Briar Spring Ct
- 15503 Rose Ridge Ct