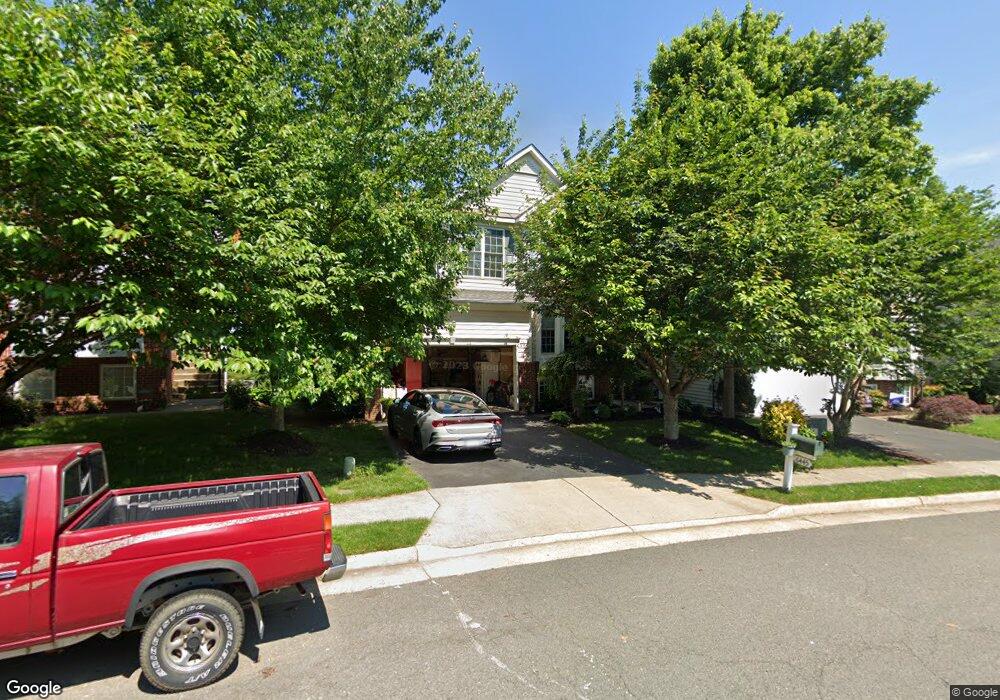
6445 Ashby Grove Loop Haymarket, VA 20169
Piedmont South NeighborhoodEstimated Value: $756,401 - $903,000
4
Beds
4
Baths
2,209
Sq Ft
$370/Sq Ft
Est. Value
About This Home
This home is located at 6445 Ashby Grove Loop, Haymarket, VA 20169 and is currently estimated at $816,850, approximately $369 per square foot. 6445 Ashby Grove Loop is a home located in Prince William County with nearby schools including Mountain View Elementary School, Bull Run Middle School, and Battlefield High School.
Ownership History
Date
Name
Owned For
Owner Type
Purchase Details
Closed on
Feb 24, 2004
Sold by
Trevlyn Nathaniel
Bought by
Shelton Bradford N
Current Estimated Value
Home Financials for this Owner
Home Financials are based on the most recent Mortgage that was taken out on this home.
Original Mortgage
$319,920
Outstanding Balance
$149,307
Interest Rate
5.65%
Mortgage Type
New Conventional
Estimated Equity
$667,543
Purchase Details
Closed on
Mar 29, 2002
Sold by
Beazer Homes Corp
Bought by
Nathaniel Trevlyn
Home Financials for this Owner
Home Financials are based on the most recent Mortgage that was taken out on this home.
Original Mortgage
$220,000
Interest Rate
6.85%
Mortgage Type
New Conventional
Purchase Details
Closed on
Nov 17, 2001
Sold by
Piedmont Lc
Bought by
Beazer Homes Corp
Create a Home Valuation Report for This Property
The Home Valuation Report is an in-depth analysis detailing your home's value as well as a comparison with similar homes in the area
Home Values in the Area
Average Home Value in this Area
Purchase History
| Date | Buyer | Sale Price | Title Company |
|---|---|---|---|
| Shelton Bradford N | $399,900 | -- | |
| Nathaniel Trevlyn | $297,735 | -- | |
| Beazer Homes Corp | $761,000 | -- |
Source: Public Records
Mortgage History
| Date | Status | Borrower | Loan Amount |
|---|---|---|---|
| Open | Shelton Bradford N | $319,920 | |
| Previous Owner | Nathaniel Trevlyn | $220,000 |
Source: Public Records
Tax History Compared to Growth
Tax History
| Year | Tax Paid | Tax Assessment Tax Assessment Total Assessment is a certain percentage of the fair market value that is determined by local assessors to be the total taxable value of land and additions on the property. | Land | Improvement |
|---|---|---|---|---|
| 2025 | $6,581 | $713,100 | $215,300 | $497,800 |
| 2024 | $6,581 | $661,700 | $204,100 | $457,600 |
| 2023 | $6,354 | $610,700 | $188,000 | $422,700 |
| 2022 | $6,563 | $592,600 | $178,900 | $413,700 |
| 2021 | $5,902 | $483,700 | $161,000 | $322,700 |
| 2020 | $7,022 | $453,000 | $147,900 | $305,100 |
| 2019 | $7,065 | $455,800 | $147,900 | $307,900 |
| 2018 | $5,088 | $421,400 | $140,000 | $281,400 |
| 2017 | $5,122 | $415,400 | $124,900 | $290,500 |
| 2016 | $4,886 | $399,700 | $111,200 | $288,500 |
| 2015 | $4,835 | $415,600 | $110,500 | $305,100 |
| 2014 | $4,835 | $387,100 | $110,400 | $276,700 |
Source: Public Records
Map
Nearby Homes
- 14530 Guilford Ridge Rd
- 6520 Old Carolina Rd
- 6600 Brave Ct
- 7060 Courtyard Way
- 14400 Verde Place
- 13849 Piedmont Vista Dr
- 6821 Hampton Bay Ln
- 15055 Jaxton Square Ln
- 6020 Dunnbrook Terrace
- 6313 Iris Meadow Ln
- 14592 Kylewood Way Unit 13
- 6872 Witton Cir
- 6907 Stanwick Square
- 15269 Avens Creek Dr Unit 79
- 6066 Aster Haven Cir Unit 131
- 6816 Fayette St
- 14431 Colonel Wood Rd
- 6133 Camerons Ferry Dr
- 6796 Fayette St
- 6117 Camerons Ferry Dr
- 6449 Ashby Grove Loop
- 6441 Ashby Grove Loop
- 6453 Ashby Grove Loop
- 6437 Ashby Grove Loop
- 6457 Ashby Grove Loop
- 6448 Ashby Grove Loop
- 6442 Ashby Grove Loop
- 6460 Ashby Grove Loop
- 6461 Ashby Grove Loop
- 6438 Ashby Grove Loop
- 6464 Ashby Grove Loop
- 6433 Ashby Grove Loop
- 6465 Ashby Grove Loop
- 14651 Celeste Ct
- 6468 Ashby Grove Loop
- 6434 Ashby Grove Loop
- 6469 Ashby Grove Loop
- 6429 Ashby Grove Loop
- 14647 Celeste Ct
- 6430 Ashby Grove Loop