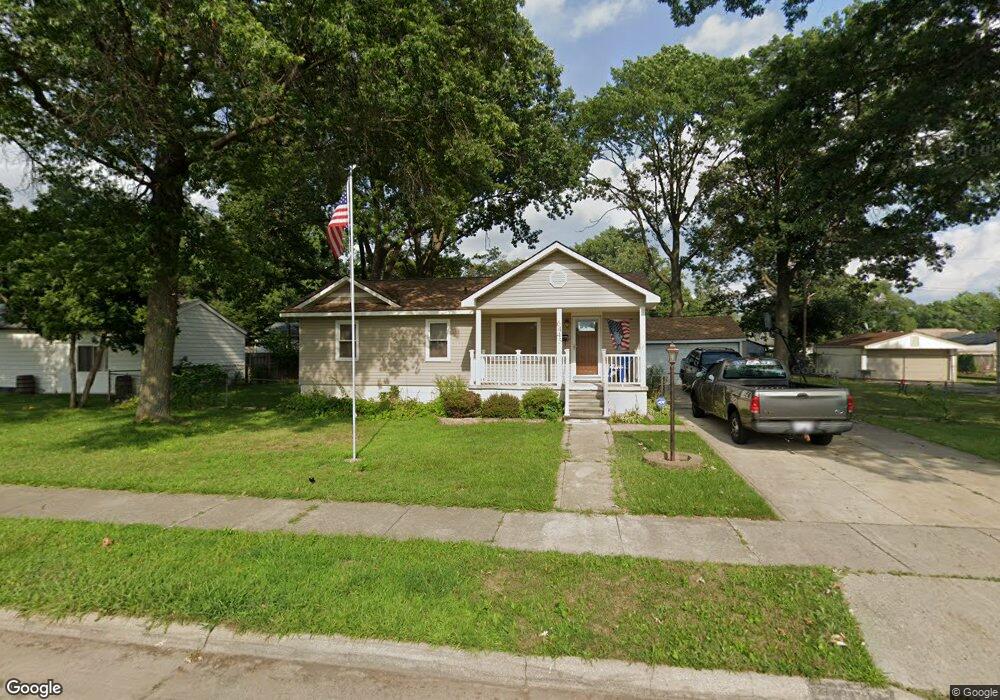
6445 Pine St Taylor, MI 48180
Estimated Value: $165,000 - $191,000
Studio
--
Bath
1,169
Sq Ft
$154/Sq Ft
Est. Value
About This Home
This home is located at 6445 Pine St, Taylor, MI 48180 and is currently estimated at $180,395, approximately $154 per square foot. 6445 Pine St is a home located in Wayne County with nearby schools including Clarence Randall Elementary School, Hoover Middle School, and Quest Charter Academy.
Ownership History
Date
Name
Owned For
Owner Type
Purchase Details
Closed on
Mar 18, 2016
Sold by
Gerrity Joseph and Gerrity Miriam
Bought by
Gerrity Gerald E
Current Estimated Value
Purchase Details
Closed on
Jan 23, 2007
Sold by
The Bank Of New York
Bought by
Gerrity Joseph
Purchase Details
Closed on
Mar 7, 2006
Sold by
Equicredit
Bought by
The Bank Of New York and Eqcc Asset Backed Certificates Series 20
Purchase Details
Closed on
Feb 22, 2001
Sold by
Borden Lynda
Bought by
Borden James
Create a Home Valuation Report for This Property
The Home Valuation Report is an in-depth analysis detailing your home's value as well as a comparison with similar homes in the area
Home Values in the Area
Average Home Value in this Area
Purchase History
| Date | Buyer | Sale Price | Title Company |
|---|---|---|---|
| Gerrity Gerald E | $74,000 | Embassy Title Agency | |
| Gerrity Joseph | $54,000 | Attorneys Title Agency Llc | |
| The Bank Of New York | -- | None Available | |
| Borden James | -- | -- |
Source: Public Records
Tax History
| Year | Tax Paid | Tax Assessment Tax Assessment Total Assessment is a certain percentage of the fair market value that is determined by local assessors to be the total taxable value of land and additions on the property. | Land | Improvement |
|---|---|---|---|---|
| 2025 | $1,717 | $88,000 | $0 | $0 |
| 2024 | $1,662 | $77,500 | $0 | $0 |
| 2023 | $2,126 | $69,000 | $0 | $0 |
| 2022 | $1,586 | $62,300 | $0 | $0 |
| 2021 | $2,088 | $56,700 | $0 | $0 |
| 2020 | $1,999 | $50,900 | $0 | $0 |
| 2019 | $175,805 | $40,300 | $0 | $0 |
| 2018 | $1,362 | $31,800 | $0 | $0 |
| 2017 | $819 | $31,800 | $0 | $0 |
| 2016 | $1,738 | $31,000 | $0 | $0 |
| 2015 | $3,850 | $38,500 | $0 | $0 |
| 2013 | $3,850 | $39,400 | $0 | $0 |
| 2012 | $2,361 | $39,100 | $22,100 | $17,000 |
Source: Public Records
Map
Nearby Homes
- 6456 Birch St
- 6587 Elm St
- 6625 Birch St
- 6688 Madison St
- 6606 Cornell St
- 6753 Madison St
- 6864 Cornell St
- 6784 Cooper St
- 7166 Pardee Rd
- 5871 Cooper St
- 6420 Burr St
- 5689 Cornell St
- 6773 Burr St
- 6605 Bailey St
- 5578 Grindley Park St
- 6469 Troy St
- 22823 N Brookside Dr
- 000 Hanover St
- 7912 Pine St
- 6004 Monroe Blvd
Your Personal Tour Guide
Ask me questions while you tour the home.