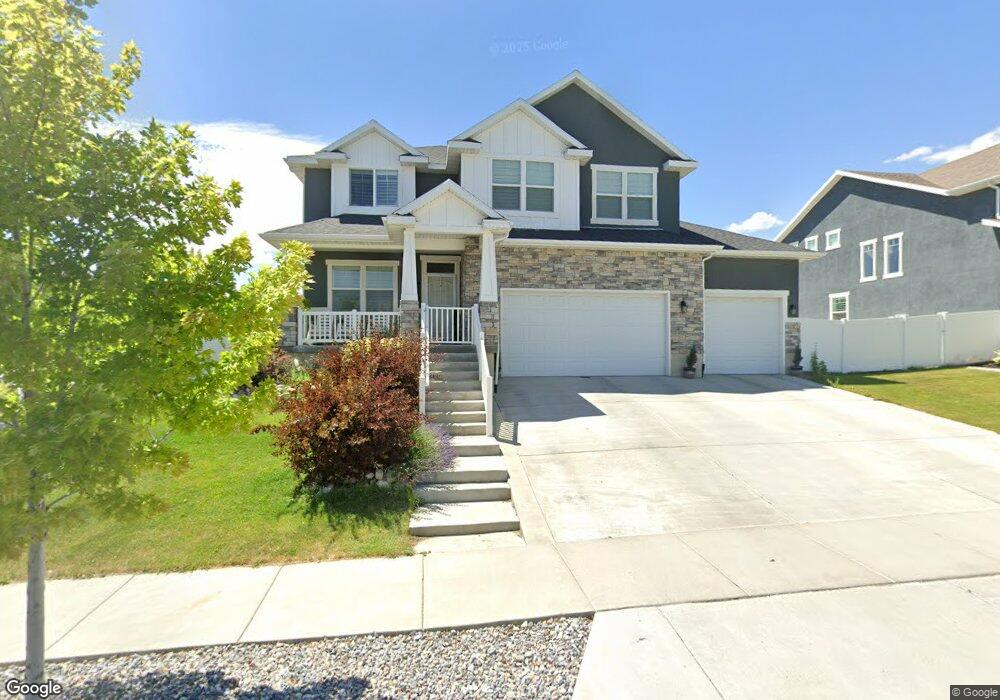
6449 W 7870 S Unit 317 West Jordan, UT 84081
Jordan Hills NeighborhoodEstimated Value: $700,000 - $762,000
4
Beds
3
Baths
3,530
Sq Ft
$209/Sq Ft
Est. Value
About This Home
This home is located at 6449 W 7870 S Unit 317, West Jordan, UT 84081 and is currently estimated at $739,435, approximately $209 per square foot. 6449 W 7870 S Unit 317 is a home located in Salt Lake County with nearby schools including Oakcrest Elementary School, Sunset Ridge Middle School, and Copper Hills High School.
Ownership History
Date
Name
Owned For
Owner Type
Purchase Details
Closed on
Mar 22, 2020
Sold by
Irvine Ashley A and Cameron Ashley A
Bought by
Cameron Ashley A
Current Estimated Value
Home Financials for this Owner
Home Financials are based on the most recent Mortgage that was taken out on this home.
Original Mortgage
$382,000
Outstanding Balance
$337,019
Interest Rate
3.3%
Mortgage Type
New Conventional
Estimated Equity
$402,416
Purchase Details
Closed on
Jun 27, 2017
Sold by
Millcreek Homes Inc
Bought by
Irvine Ashley A
Home Financials for this Owner
Home Financials are based on the most recent Mortgage that was taken out on this home.
Original Mortgage
$394,397
Interest Rate
4.02%
Mortgage Type
New Conventional
Purchase Details
Closed on
Mar 30, 2016
Sold by
Boyer Loneview Lc
Bought by
Millcreek Homes Inc
Home Financials for this Owner
Home Financials are based on the most recent Mortgage that was taken out on this home.
Original Mortgage
$277,200
Interest Rate
3.64%
Mortgage Type
Commercial
Create a Home Valuation Report for This Property
The Home Valuation Report is an in-depth analysis detailing your home's value as well as a comparison with similar homes in the area
Home Values in the Area
Average Home Value in this Area
Purchase History
| Date | Buyer | Sale Price | Title Company |
|---|---|---|---|
| Cameron Ashley A | -- | Servicelink | |
| Irvine Ashley A | -- | Gt Title Services Slc | |
| Millcreek Homes Inc | -- | Meridian Title |
Source: Public Records
Mortgage History
| Date | Status | Borrower | Loan Amount |
|---|---|---|---|
| Open | Cameron Ashley A | $382,000 | |
| Closed | Irvine Ashley A | $394,397 | |
| Previous Owner | Millcreek Homes Inc | $277,200 |
Source: Public Records
Tax History Compared to Growth
Tax History
| Year | Tax Paid | Tax Assessment Tax Assessment Total Assessment is a certain percentage of the fair market value that is determined by local assessors to be the total taxable value of land and additions on the property. | Land | Improvement |
|---|---|---|---|---|
| 2025 | $3,599 | $714,900 | $167,600 | $547,300 |
| 2024 | $3,599 | $692,500 | $162,700 | $529,800 |
| 2023 | $3,662 | $664,100 | $156,500 | $507,600 |
| 2022 | $3,703 | $660,500 | $153,400 | $507,100 |
| 2021 | $3,123 | $507,100 | $120,800 | $386,300 |
| 2020 | $2,856 | $435,200 | $120,800 | $314,400 |
| 2019 | $2,876 | $429,800 | $120,800 | $309,000 |
| 2018 | $2,724 | $403,800 | $118,900 | $284,900 |
| 2017 | $1,465 | $118,900 | $118,900 | $0 |
| 2016 | $1,521 | $116,000 | $116,000 | $0 |
Source: Public Records
Map
Nearby Homes
- 6343 W 7900 S
- 7991 S Ambrosia Ln
- 6593 W 7870 S
- 6602 W Braeburn Way
- 8043 S Ambrosia Ln
- 6621 W Braeburn Way
- 6463 W Maple Valley Cir Unit 1030
- 7923 S Red Baron Ln
- Accord Plan at Orchard Heights
- Interlude Plan at Orchard Heights
- Octave Plan at Orchard Heights
- Treble Plan at Orchard Heights
- Princeton Plan at Orchard Heights
- Adagio Plan at Orchard Heights
- Forte Plan at Orchard Heights
- Tempo Plan at Orchard Heights
- Concerto Plan at Orchard Heights
- Rhapsody Plan at Orchard Heights
- Yalecrest Plan at Orchard Heights
- Bravo Plan at Orchard Heights
- 6467 W 7870 S
- 6452 W 7910 S
- 6468 W 7910 S
- 7893 S Beechgrove Dr
- 7893 S Beechgrove Dr Unit 301
- 7877 S Beechgrove Dr
- 7877 S Beechgrove Dr Unit 302
- 6487 W 7870 S
- 6454 W 7870 S Unit 316
- 7901 S Beechgrove Dr
- 6472 W 7870 S
- 6482 W 7910 S
- 7863 S Beechgrove Dr Unit 303
- 7863 S Beechgrove Dr
- 6484 W 7870 S
- 7907 S Beechgrove Dr Unit 219
- 7907 S Beechgrove Dr
- 6503 W 7870 S
- 7847 S Beechgrove Dr
- 6498 W 7910 S