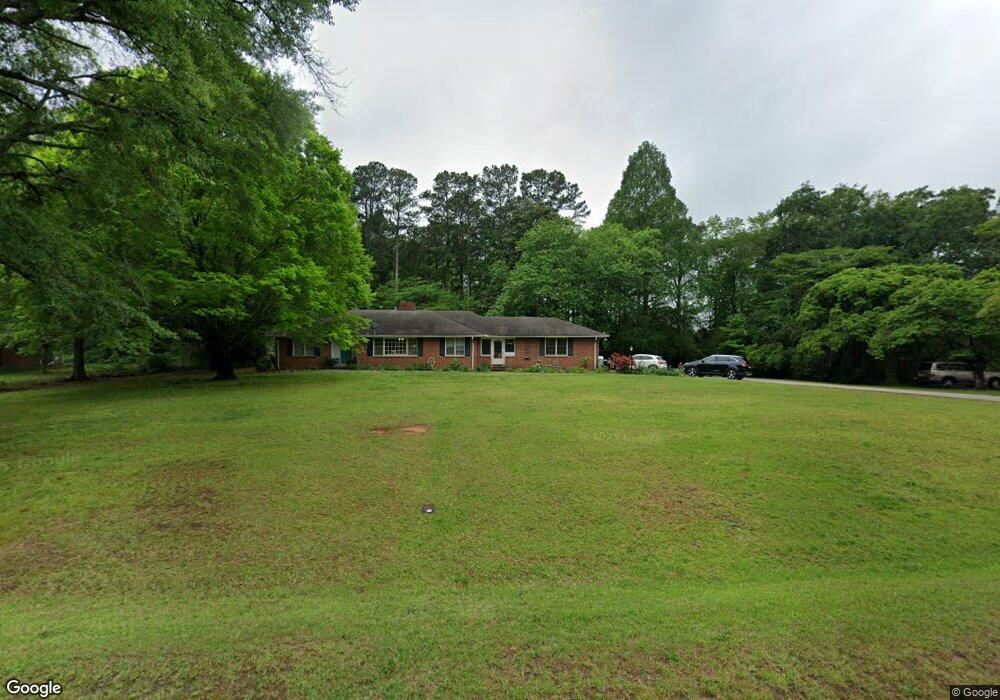
645 Bradley Dr Fayetteville, GA 30214
Estimated Value: $269,000 - $300,000
--
Bed
2
Baths
2,127
Sq Ft
$131/Sq Ft
Est. Value
About This Home
This home is located at 645 Bradley Dr, Fayetteville, GA 30214 and is currently estimated at $278,084, approximately $130 per square foot. 645 Bradley Dr is a home located in Fayette County with nearby schools including Spring Hill Elementary School, Bennett's Mill Middle School, and Fayette County High School.
Ownership History
Date
Name
Owned For
Owner Type
Purchase Details
Closed on
Jun 16, 2025
Sold by
King Constance B
Bought by
Hammond Mark
Current Estimated Value
Home Financials for this Owner
Home Financials are based on the most recent Mortgage that was taken out on this home.
Original Mortgage
$258,495
Outstanding Balance
$257,825
Interest Rate
6.76%
Mortgage Type
New Conventional
Estimated Equity
$20,259
Purchase Details
Closed on
Jun 10, 2003
Sold by
Weed Maudell
Bought by
King Charles A and King Constance
Purchase Details
Closed on
Sep 2, 1994
Sold by
Langley Dorothy F
Bought by
Weed Maudell
Home Financials for this Owner
Home Financials are based on the most recent Mortgage that was taken out on this home.
Original Mortgage
$81,700
Interest Rate
8.56%
Create a Home Valuation Report for This Property
The Home Valuation Report is an in-depth analysis detailing your home's value as well as a comparison with similar homes in the area
Home Values in the Area
Average Home Value in this Area
Purchase History
| Date | Buyer | Sale Price | Title Company |
|---|---|---|---|
| Hammond Mark | $272,100 | None Listed On Document | |
| Hammond Mark | $25,000 | None Listed On Document | |
| Hammond Mark | $25,000 | None Listed On Document | |
| King Charles A | $130,000 | -- | |
| Weed Maudell | $86,000 | -- |
Source: Public Records
Mortgage History
| Date | Status | Borrower | Loan Amount |
|---|---|---|---|
| Open | Hammond Mark | $258,495 | |
| Closed | Hammond Mark | $258,495 | |
| Previous Owner | Weed Maudell | $81,700 |
Source: Public Records
Tax History Compared to Growth
Tax History
| Year | Tax Paid | Tax Assessment Tax Assessment Total Assessment is a certain percentage of the fair market value that is determined by local assessors to be the total taxable value of land and additions on the property. | Land | Improvement |
|---|---|---|---|---|
| 2024 | $3,098 | $104,244 | $11,040 | $93,204 |
| 2023 | $3,098 | $92,160 | $11,040 | $81,120 |
| 2022 | $2,674 | $88,000 | $11,040 | $76,960 |
| 2021 | $2,264 | $73,560 | $11,040 | $62,520 |
| 2020 | $2,036 | $65,840 | $11,040 | $54,800 |
| 2019 | $1,960 | $62,760 | $11,040 | $51,720 |
| 2018 | $1,823 | $57,760 | $9,840 | $47,920 |
| 2017 | $1,505 | $50,320 | $9,600 | $40,720 |
| 2016 | $1,375 | $45,000 | $9,600 | $35,400 |
| 2015 | $1,303 | $41,880 | $9,600 | $32,280 |
| 2014 | $1,209 | $38,160 | $9,600 | $28,560 |
| 2013 | -- | $37,600 | $0 | $0 |
Source: Public Records
Map
Nearby Homes
- 170 Woodstream Way Unit B
- 110 Lindsey Terrace
- 235 Woodstream Way
- 415 Williamsburg Way
- 665 Beauregard Blvd
- 155 Medford Dr
- 110 Sparrows Cove
- The Bradford Plan at Mitchell Estates
- The Mildred Plan at Mitchell Estates
- 295 Cobalt Dr
- 305 Cobalt Dr
- 430 Plainfield St
- 180 Plainfield St
- 315 Walker Ave
- 601 S Jeff Davis Dr Unit LOT 2
- 315 Ivanhoe Dr
- 130 Thrushwood Dr
- 4010 Diane Ln
- 4080 Diane Ln
- 145 Thrushwood Dr
- 665 Bradley Dr
- 643 Bradley Dr
- 660 Bradley Dr
- 640 Bradley Dr
- 605 Bradley Dr
- 0 Bradley Dr Unit 3270397
- 0 Bradley Dr Unit 7588200
- 0 Bradley Dr Unit 7508805
- 0 Bradley Dr Unit 8475195
- 0 Bradley Dr Unit 7109017
- 0 Bradley Dr Unit 8534759
- 0 Bradley Dr Unit 9009453
- 0 Bradley Dr Unit 8753038
- 0 Bradley Dr Unit 8767201
- 0 Bradley Dr
- 610 Bradley Dr
- 595 Bradley Dr
- 0 Fayetteville
- 705 Fayetteville
- 715 James W Dixon Dr