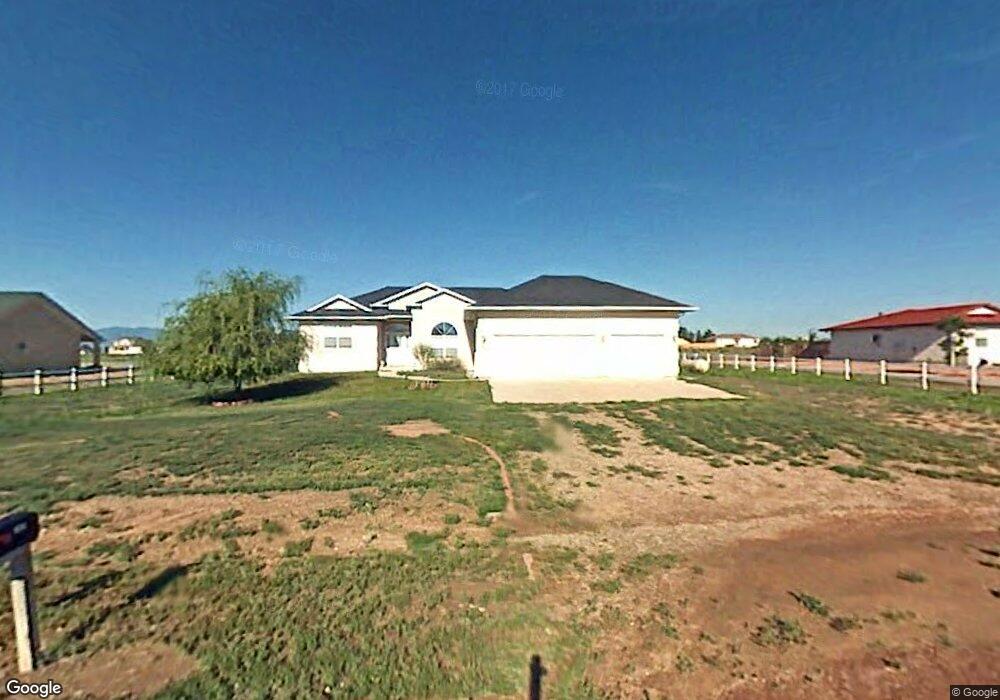
645 Camino Del Contento Pueblo West, CO 81007
Estimated Value: $401,000 - $417,534
3
Beds
3
Baths
1,769
Sq Ft
$231/Sq Ft
Est. Value
About This Home
This home is located at 645 Camino Del Contento, Pueblo West, CO 81007 and is currently estimated at $409,134, approximately $231 per square foot. 645 Camino Del Contento is a home located in Pueblo County with nearby schools including Sierra Vista Elementary School, Sky View Middle School, and Pueblo West High School.
Ownership History
Date
Name
Owned For
Owner Type
Purchase Details
Closed on
Feb 27, 2025
Sold by
Bower Linda M
Bought by
Villalva Joe T and Villalva Jennie L
Current Estimated Value
Home Financials for this Owner
Home Financials are based on the most recent Mortgage that was taken out on this home.
Original Mortgage
$376,475
Outstanding Balance
$374,611
Interest Rate
7.04%
Mortgage Type
FHA
Estimated Equity
$34,523
Purchase Details
Closed on
Mar 18, 2013
Sold by
Onewest Bank Fsb
Bought by
Fannie Mae
Purchase Details
Closed on
May 22, 2000
Sold by
Snyder Douglas S
Bought by
Moore Vera Bearfoot
Purchase Details
Closed on
Oct 15, 1999
Sold by
Moore Vera Bearfoot
Bought by
Snyder Douglas S
Purchase Details
Closed on
Aug 24, 1999
Sold by
Heldt Evan G + Frances E
Bought by
Moore Vera Bearfoot
Purchase Details
Closed on
Aug 10, 1984
Sold by
Lawyers Title Of Pueblo
Bought by
Heldt Evan G + Frances E
Create a Home Valuation Report for This Property
The Home Valuation Report is an in-depth analysis detailing your home's value as well as a comparison with similar homes in the area
Home Values in the Area
Average Home Value in this Area
Purchase History
| Date | Buyer | Sale Price | Title Company |
|---|---|---|---|
| Villalva Joe T | $200,000 | Land Title Guarantee | |
| Villalva Joe T | $200,000 | None Listed On Document | |
| Fannie Mae | -- | None Available | |
| Moore Vera Bearfoot | $176,000 | -- | |
| Snyder Douglas S | -- | -- | |
| Moore Vera Bearfoot | $9,500 | -- | |
| Heldt Evan G + Frances E | -- | -- |
Source: Public Records
Mortgage History
| Date | Status | Borrower | Loan Amount |
|---|---|---|---|
| Open | Villalva Joe T | $376,475 |
Source: Public Records
Tax History Compared to Growth
Tax History
| Year | Tax Paid | Tax Assessment Tax Assessment Total Assessment is a certain percentage of the fair market value that is determined by local assessors to be the total taxable value of land and additions on the property. | Land | Improvement |
|---|---|---|---|---|
| 2024 | $2,553 | $25,450 | -- | -- |
| 2023 | $2,924 | $32,500 | $3,920 | $28,580 |
| 2022 | $2,431 | $24,225 | $3,130 | $21,095 |
| 2021 | $2,492 | $24,920 | $3,220 | $21,700 |
| 2020 | $1,981 | $22,420 | $3,220 | $19,200 |
| 2019 | $1,976 | $19,769 | $715 | $19,054 |
| 2018 | $1,786 | $17,859 | $720 | $17,139 |
| 2017 | $1,788 | $17,859 | $720 | $17,139 |
| 2016 | $1,734 | $17,355 | $1,353 | $16,002 |
| 2015 | $1,720 | $17,355 | $1,353 | $16,002 |
| 2014 | $1,477 | $14,891 | $1,353 | $13,538 |
Source: Public Records
Map
Nearby Homes
- 1015 W Stallion Dr
- 1060 W Stallion Dr
- 1004 W Camino Al Cielo
- 1003 W Camino Al Cielo
- 1023 W El Nido Dr
- 1073 W El Esperante Dr
- 644 S Avenida Del Oro E
- 497 S Avenida Del Oro E
- 1222 S Avenida Del Oro E
- 424 S Avenida Del Oro E
- 922 W Saguache Dr
- 862 S Los Mochis Way
- 1127 W Mescalero Dr
- 1224 W Calle Antigua
- 925 S Camino Santiago Dr
- 1250 W Presidio Dr
- 562 S Ferncliff Dr
- 886 S Camino de Bravo
- 354 S Hacienda Del Sol Dr
- 1340 W Oro Grande Dr
- 653 Camino Del Contento S
- 653 Camino Del Contento S Unit 5
- 653 Camino Del Contento
- 637 Camino Del Contento S
- 1011 W El Capitan Dr
- 1011 W El Capitan Dr Unit 4
- 665 Camino Del Contento S
- 623 Camino Del Contento S
- 1014 W El Capitan Dr
- 679 Camino Del Contento S
- 679 Camino Del Contento S Unit 7
- 679 Camino Del Contento
- 611 Camino Del Contento S
- 611 Camino Del Contento S
- 1006 W El Capitan Dr
- 650 S Palo Pinto Dr
- 642 S Palo Pinto Dr
- 1010 W Calle Del Ciervo
- 634 S Palo Pinto Dr
- 662 S Palo Pinto Dr