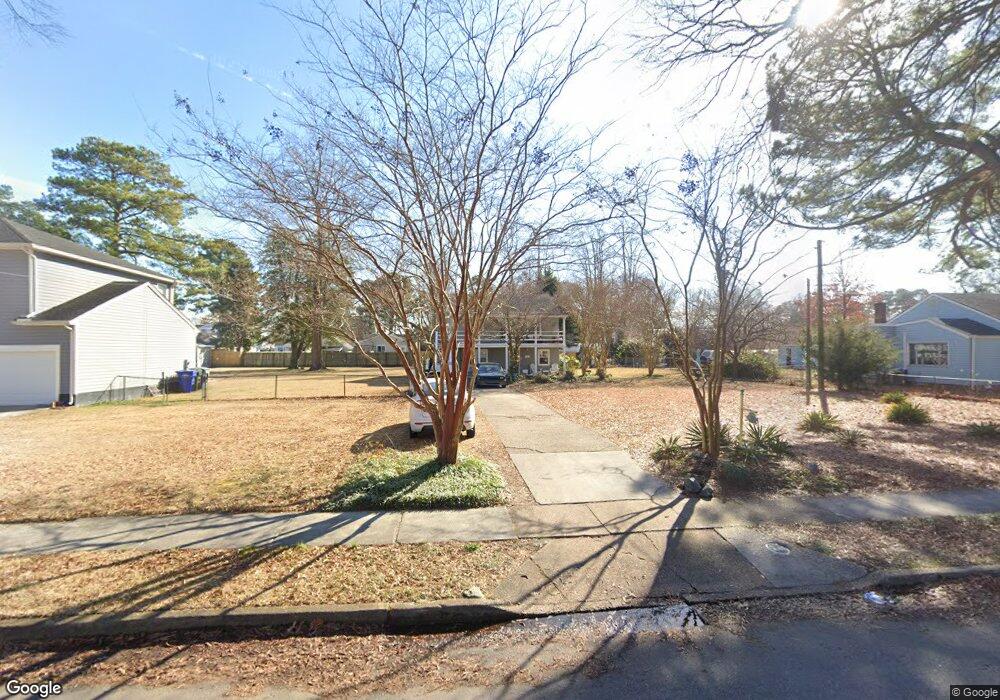
645 Dune St Unit B Norfolk, VA 23503
Northside NeighborhoodEstimated Value: $252,344 - $331,000
2
Beds
1
Bath
1,556
Sq Ft
$176/Sq Ft
Est. Value
About This Home
This home is located at 645 Dune St Unit B, Norfolk, VA 23503 and is currently estimated at $273,086, approximately $175 per square foot. 645 Dune St Unit B is a home located in Norfolk City with nearby schools including Mary Calcott Elementary School, Northside Middle School, and Granby High School.
Ownership History
Date
Name
Owned For
Owner Type
Purchase Details
Closed on
Sep 8, 2006
Sold by
Sherron Shirley Cooper
Bought by
Shirvani Felecia
Current Estimated Value
Home Financials for this Owner
Home Financials are based on the most recent Mortgage that was taken out on this home.
Original Mortgage
$27,200
Outstanding Balance
$16,263
Interest Rate
6.59%
Mortgage Type
Stand Alone Second
Estimated Equity
$256,823
Create a Home Valuation Report for This Property
The Home Valuation Report is an in-depth analysis detailing your home's value as well as a comparison with similar homes in the area
Home Values in the Area
Average Home Value in this Area
Purchase History
| Date | Buyer | Sale Price | Title Company |
|---|---|---|---|
| Shirvani Felecia | $164,100 | -- |
Source: Public Records
Mortgage History
| Date | Status | Borrower | Loan Amount |
|---|---|---|---|
| Open | Shirvani Felecia | $27,200 | |
| Open | Shirvani Felecia | $108,800 |
Source: Public Records
Tax History
| Year | Tax Paid | Tax Assessment Tax Assessment Total Assessment is a certain percentage of the fair market value that is determined by local assessors to be the total taxable value of land and additions on the property. | Land | Improvement |
|---|---|---|---|---|
| 2025 | $2,966 | $237,300 | $99,000 | $138,300 |
| 2024 | $2,883 | $230,600 | $99,000 | $131,600 |
| 2023 | $2,801 | $224,100 | $99,000 | $125,100 |
| 2022 | $2,678 | $214,200 | $90,200 | $124,000 |
| 2021 | $2,494 | $199,500 | $82,000 | $117,500 |
| 2020 | $2,311 | $184,900 | $71,500 | $113,400 |
| 2019 | $2,230 | $178,400 | $65,000 | $113,400 |
| 2018 | $2,101 | $168,100 | $65,000 | $103,100 |
| 2017 | $1,903 | $165,500 | $65,000 | $100,500 |
| 2016 | $1,903 | $161,300 | $65,000 | $96,300 |
| 2015 | $1,855 | $161,300 | $65,000 | $96,300 |
| 2014 | $1,855 | $161,300 | $65,000 | $96,300 |
Source: Public Records
Map
Nearby Homes
- 8723 Chesapeake Blvd
- 700 Creamer Rd
- 511 Dune St
- 515 Earl St
- 8546 Old Ocean View Rd
- 8575 Chesapeake Blvd
- 8911 London St
- 8582 Chesapeake Blvd
- 8582 Chesapeake Blvd Unit 306
- 409 E Westmont Ave
- 8583 Wayland St
- 8810 Devon St
- 1050 E Chester St
- 8704 Tidewater Dr
- 8521 Chapin St
- 8718 Tidewater Dr
- 8717 Tidewater Dr
- 8534 Chesapeake Blvd
- 8506 Old Ocean View Rd
- 318 E Westmont Ave
Your Personal Tour Guide
Ask me questions while you tour the home.