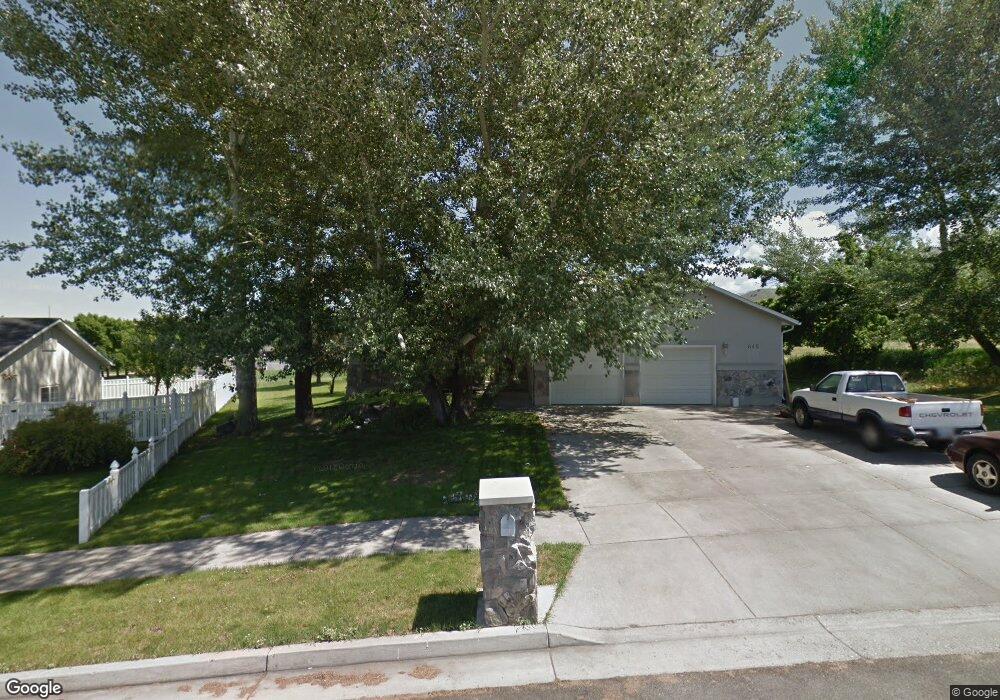
645 E 210 S Smithfield, UT 84335
Estimated Value: $467,000 - $555,000
Studio
--
Bath
1,717
Sq Ft
$308/Sq Ft
Est. Value
About This Home
This home is located at 645 E 210 S, Smithfield, UT 84335 and is currently estimated at $529,377, approximately $308 per square foot. 645 E 210 S is a home with nearby schools including Sunrise School, Cedar Ridge School, and North Cache Middle School.
Ownership History
Date
Name
Owned For
Owner Type
Purchase Details
Closed on
Jul 31, 2015
Sold by
Rash Brooks and Rash Patricia
Bought by
Delatore Jeffrey R and Delatore Lauren A
Current Estimated Value
Home Financials for this Owner
Home Financials are based on the most recent Mortgage that was taken out on this home.
Original Mortgage
$281,147
Outstanding Balance
$219,528
Interest Rate
3.98%
Mortgage Type
New Conventional
Estimated Equity
$309,849
Purchase Details
Closed on
Apr 7, 2009
Sold by
Rash Brooks L and Rash Patricia H
Bought by
Rash Brooks and Rash Patricia
Home Financials for this Owner
Home Financials are based on the most recent Mortgage that was taken out on this home.
Original Mortgage
$130,000
Interest Rate
5.06%
Mortgage Type
New Conventional
Create a Home Valuation Report for This Property
The Home Valuation Report is an in-depth analysis detailing your home's value as well as a comparison with similar homes in the area
Home Values in the Area
Average Home Value in this Area
Purchase History
| Date | Buyer | Sale Price | Title Company |
|---|---|---|---|
| Delatore Jeffrey R | -- | Northern Title Company | |
| Rash Brooks | -- | Hickman Land Title Company |
Source: Public Records
Mortgage History
| Date | Status | Borrower | Loan Amount |
|---|---|---|---|
| Open | Delatore Jeffrey R | $281,147 | |
| Previous Owner | Rash Brooks | $130,000 |
Source: Public Records
Tax History
| Year | Tax Paid | Tax Assessment Tax Assessment Total Assessment is a certain percentage of the fair market value that is determined by local assessors to be the total taxable value of land and additions on the property. | Land | Improvement |
|---|---|---|---|---|
| 2025 | $2,263 | $302,950 | $0 | $0 |
| 2024 | $2,074 | $260,400 | $0 | $0 |
| 2023 | $2,168 | $257,515 | $0 | $0 |
| 2022 | $2,204 | $257,510 | $0 | $0 |
| 2021 | $2,162 | $385,965 | $57,000 | $328,965 |
| 2020 | $1,939 | $322,903 | $57,000 | $265,903 |
| 2019 | $2,008 | $318,703 | $52,800 | $265,903 |
| 2018 | $1,850 | $284,020 | $52,800 | $231,220 |
| 2017 | $1,725 | $144,650 | $0 | $0 |
| 2016 | $1,755 | $144,650 | $0 | $0 |
| 2015 | $1,514 | $124,245 | $0 | $0 |
| 2014 | $1,472 | $123,200 | $0 | $0 |
| 2013 | -- | $123,200 | $0 | $0 |
Source: Public Records
Map
Nearby Homes
- 396 S 455 E
- 442 S 455 E
- 127 S 830 E Unit 304
- 485 Parkview Cir
- 139 Fairway Dr
- 125 Fairway Dr
- 1400 E 300 S
- 1092 E 300 S
- 434 S Cardon Ridge Dr
- 641 S 380 E
- 206 S 100 E
- 502 Summit Creek Dr
- 12 S 1150 E Unit 8
- 13 N 1150 E
- 818 Summit Dr
- 2 S 1200 E Unit 15
- 413 S 1150 E Unit 1101
- 111 S 1250 E
- 161 E 560 S
- 26 N 100 E
Your Personal Tour Guide
Ask me questions while you tour the home.