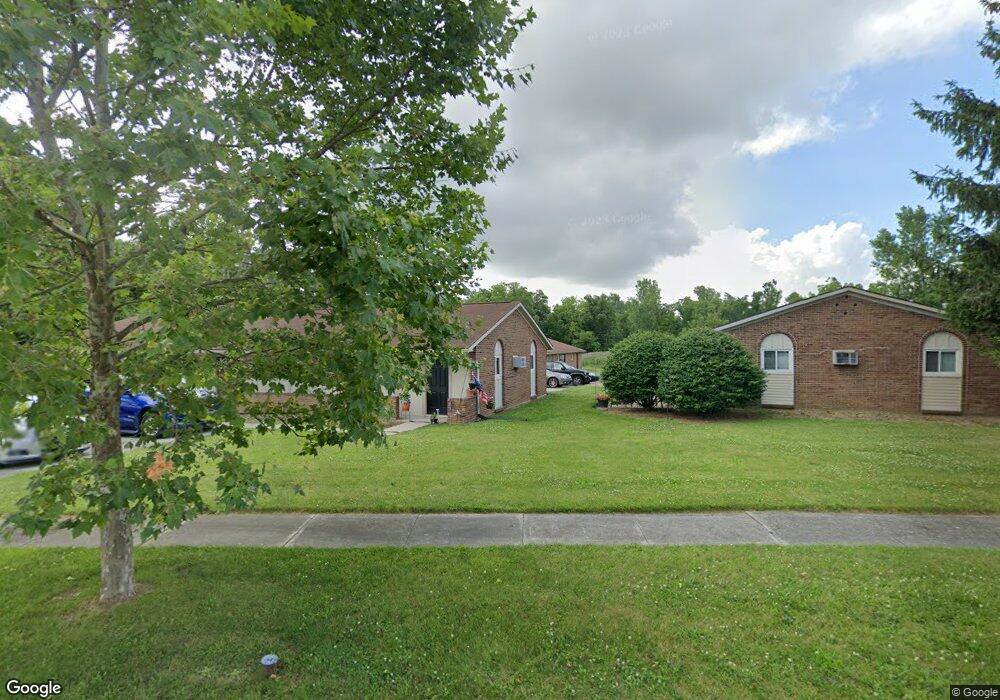
645 Grove Ln Unit 701 Saint Marys, OH 45885
Estimated Value: $202,000 - $232,000
2
Beds
1
Bath
744
Sq Ft
$296/Sq Ft
Est. Value
About This Home
This home is located at 645 Grove Ln Unit 701, Saint Marys, OH 45885 and is currently estimated at $220,000, approximately $295 per square foot. 645 Grove Ln Unit 701 is a home located in Auglaize County with nearby schools including St. Mary's East Primary School, St. Mary's West Intermediate School, and St. Marys Middle School.
Ownership History
Date
Name
Owned For
Owner Type
Purchase Details
Closed on
Dec 18, 2017
Sold by
Watervelle Properties Llc
Bought by
Premier Choice Rentals Llc
Current Estimated Value
Home Financials for this Owner
Home Financials are based on the most recent Mortgage that was taken out on this home.
Interest Rate
3.93%
Purchase Details
Closed on
Aug 19, 2009
Sold by
Lacy Jerrill L and Lacy Jacqueline L
Bought by
Watervelle Properties Llc
Home Financials for this Owner
Home Financials are based on the most recent Mortgage that was taken out on this home.
Original Mortgage
$322,000
Interest Rate
5.29%
Mortgage Type
Future Advance Clause Open End Mortgage
Purchase Details
Closed on
Apr 18, 1991
Sold by
Brumbaugh Ralph E
Bought by
Lacy Jerrill L
Create a Home Valuation Report for This Property
The Home Valuation Report is an in-depth analysis detailing your home's value as well as a comparison with similar homes in the area
Home Values in the Area
Average Home Value in this Area
Purchase History
| Date | Buyer | Sale Price | Title Company |
|---|---|---|---|
| Premier Choice Rentals Llc | $460,000 | -- | |
| Watervelle Properties Llc | $440,000 | Attorney | |
| Lacy Jerrill L | $137,100 | -- |
Source: Public Records
Mortgage History
| Date | Status | Borrower | Loan Amount |
|---|---|---|---|
| Closed | Premier Choice Rentals Llc | -- | |
| Previous Owner | Watervelle Properties Llc | $322,000 |
Source: Public Records
Tax History Compared to Growth
Tax History
| Year | Tax Paid | Tax Assessment Tax Assessment Total Assessment is a certain percentage of the fair market value that is determined by local assessors to be the total taxable value of land and additions on the property. | Land | Improvement |
|---|---|---|---|---|
| 2024 | $1,391 | $19,580 | $1,970 | $17,610 |
| 2023 | $755 | $19,580 | $1,970 | $17,610 |
| 2022 | $618 | $13,950 | $2,340 | $11,610 |
| 2021 | $598 | $13,950 | $2,340 | $11,610 |
| 2020 | $310 | $13,952 | $2,342 | $11,610 |
| 2019 | $524 | $11,722 | $1,967 | $9,755 |
| 2018 | $524 | $11,722 | $1,967 | $9,755 |
| 2017 | $524 | $11,722 | $1,967 | $9,755 |
| 2016 | $550 | $12,377 | $1,873 | $10,504 |
| 2015 | $539 | $12,377 | $1,873 | $10,504 |
| 2014 | $542 | $12,377 | $1,873 | $10,504 |
| 2013 | $561 | $12,377 | $1,873 | $10,504 |
Source: Public Records
Map
Nearby Homes
- 520 Oil St
- 332 Miami Erie Cir
- 324 Miami Erie Cir
- 308 Miami Erie Cir
- 316 Miami Erie Cir
- 345 Miami Erie Cir
- 317 Miami Erie Cir
- 313 Miami Erie Cir
- 375 Miami Erie Cir
- 341 Miami Erie Cir
- 385 Miami Erie Cir
- 367 Miami Erie Cir
- 309 Miami Erie Cir
- 712 Columbia St
- 357 Miami Erie Cir
- 374 Miami Erie Cir
- 364 Miami Erie Cir
- 366 Miami Erie Cir
- 386 Miami Erie Cir
- 390 Miami Erie Cir
- 815 Gordon Grove
- 695 Gordon Grove
- 798 Gordon Grove
- 796 Gordon Grove
- 0 Gordon Grove Ave
- 691 Gordon Grove Ave
- 691 Gordon Grove Ave
- 691 Gordon Grove Ave
- 691 Gordon Grove Ave
- 691 Gordon Grove Ave Unit 691 B
- 689 Gordon Grove
- 689 Gordon Grove Unit 1
- 689 Gordon Grove Unit 689 A
- 794 Gordon Grove
- 801 Bryarly Cir
- 792 Gordon Grove
- 797 Coventry Green
- 803 Bryarly Cir
- 800 Bryarly Cir
- 611 N Spruce St Unit 4