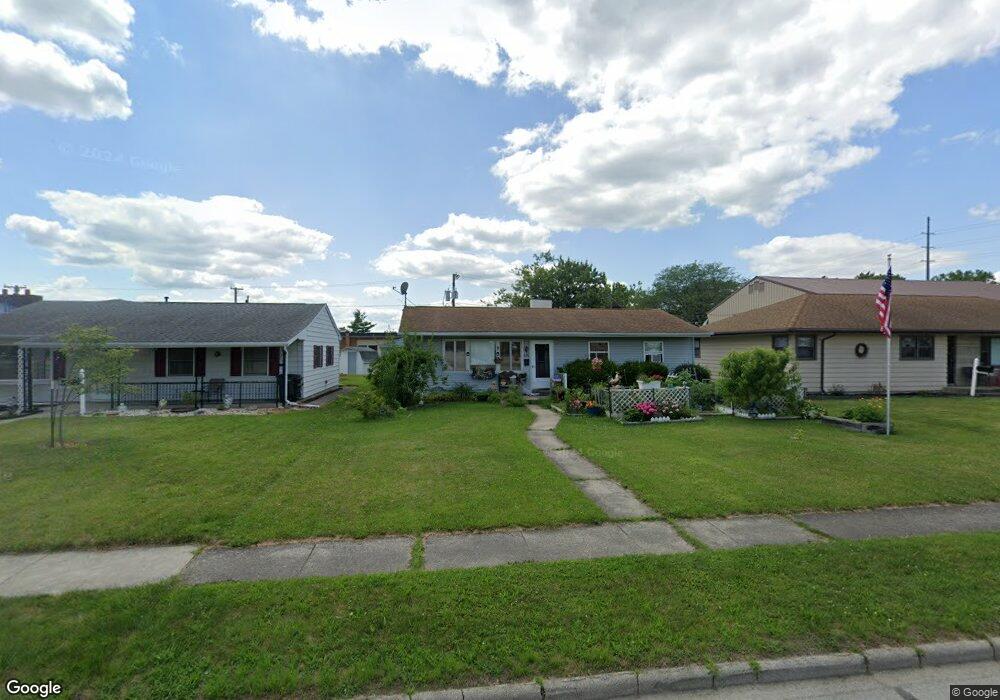
645 N 10th St Decatur, IN 46733
Estimated Value: $115,000 - $131,000
3
Beds
1
Bath
984
Sq Ft
$127/Sq Ft
Est. Value
About This Home
This home is located at 645 N 10th St, Decatur, IN 46733 and is currently estimated at $124,703, approximately $126 per square foot. 645 N 10th St is a home located in Adams County with nearby schools including Southeast Elementary School, Bellmont Elementary School, and Bellmont Middle School.
Ownership History
Date
Name
Owned For
Owner Type
Purchase Details
Closed on
Feb 19, 2014
Sold by
Gkb Enterprises
Bought by
Fitzgerald William E and Fitzgerald Loretta C
Current Estimated Value
Home Financials for this Owner
Home Financials are based on the most recent Mortgage that was taken out on this home.
Original Mortgage
$68,325
Interest Rate
4.41%
Mortgage Type
FHA
Purchase Details
Closed on
Sep 25, 2008
Sold by
Gaskill Bryan D
Bought by
Gkb Enterprises
Create a Home Valuation Report for This Property
The Home Valuation Report is an in-depth analysis detailing your home's value as well as a comparison with similar homes in the area
Home Values in the Area
Average Home Value in this Area
Purchase History
| Date | Buyer | Sale Price | Title Company |
|---|---|---|---|
| Fitzgerald William E | $64,900 | None Available | |
| Gkb Enterprises | -- | -- |
Source: Public Records
Mortgage History
| Date | Status | Borrower | Loan Amount |
|---|---|---|---|
| Previous Owner | Fitzgerald William E | $68,325 |
Source: Public Records
Tax History Compared to Growth
Tax History
| Year | Tax Paid | Tax Assessment Tax Assessment Total Assessment is a certain percentage of the fair market value that is determined by local assessors to be the total taxable value of land and additions on the property. | Land | Improvement |
|---|---|---|---|---|
| 2024 | $494 | $71,900 | $14,000 | $57,900 |
| 2023 | $479 | $66,800 | $14,000 | $52,800 |
| 2022 | $359 | $63,800 | $14,000 | $49,800 |
| 2021 | $346 | $59,500 | $14,000 | $45,500 |
| 2020 | $320 | $58,800 | $14,000 | $44,800 |
| 2019 | $307 | $58,800 | $14,000 | $44,800 |
| 2018 | $325 | $58,800 | $14,000 | $44,800 |
| 2017 | $322 | $58,900 | $13,400 | $45,500 |
| 2016 | $295 | $56,800 | $13,400 | $43,400 |
| 2014 | $263 | $55,200 | $13,400 | $41,800 |
| 2013 | $316 | $57,300 | $13,400 | $43,900 |
Source: Public Records
Map
Nearby Homes