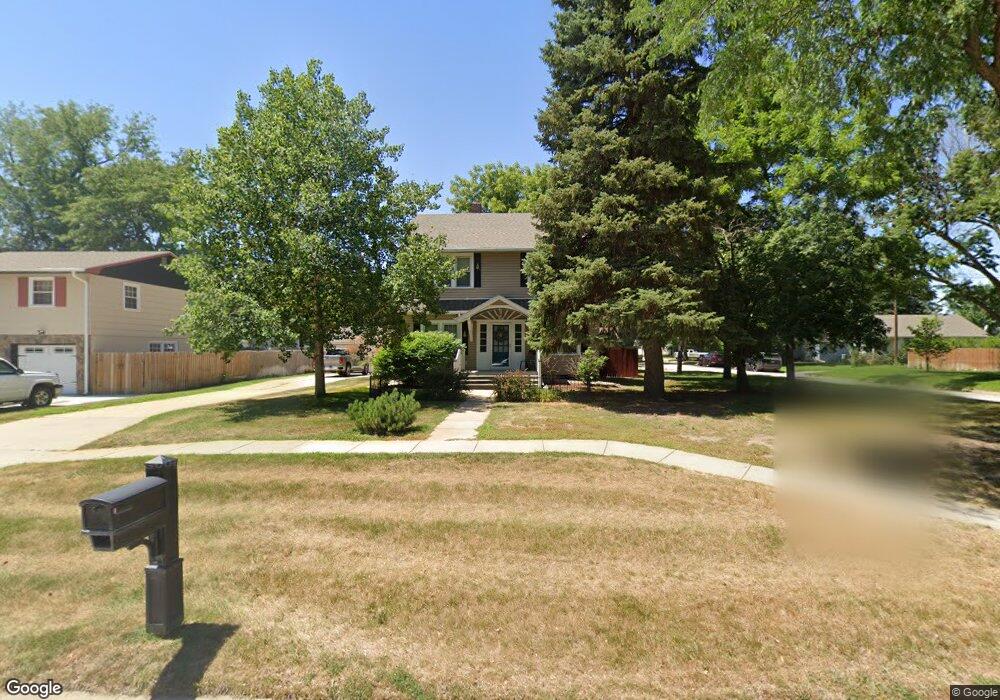
645 N 9th Ave Broken Bow, NE 68822
Estimated Value: $211,000 - $262,723
--
Bed
1
Bath
2,122
Sq Ft
$113/Sq Ft
Est. Value
About This Home
This home is located at 645 N 9th Ave, Broken Bow, NE 68822 and is currently estimated at $239,681, approximately $112 per square foot. 645 N 9th Ave is a home located in Custer County with nearby schools including North Park Elementary School, Broken Bow Junior High School, and Broken Bow High School.
Ownership History
Date
Name
Owned For
Owner Type
Purchase Details
Closed on
Nov 1, 2024
Sold by
Schmidt Troy A and Schmidt Veronica L
Bought by
Davis Hadlee R
Current Estimated Value
Home Financials for this Owner
Home Financials are based on the most recent Mortgage that was taken out on this home.
Original Mortgage
$154,000
Outstanding Balance
$151,977
Interest Rate
6.08%
Mortgage Type
New Conventional
Estimated Equity
$87,704
Purchase Details
Closed on
Jun 22, 2018
Sold by
Peterson Chris E and Peterson Deborah L
Bought by
Schmidt Troy A
Purchase Details
Closed on
Nov 15, 2013
Sold by
Holcomb Ann E
Bought by
Wooters Toby L and Wooters Sandra J
Create a Home Valuation Report for This Property
The Home Valuation Report is an in-depth analysis detailing your home's value as well as a comparison with similar homes in the area
Home Values in the Area
Average Home Value in this Area
Purchase History
| Date | Buyer | Sale Price | Title Company |
|---|---|---|---|
| Davis Hadlee R | $195,000 | Russell Title & Escrow Co | |
| Schmidt Troy A | $195,000 | -- | |
| Wooters Toby L | $160,000 | -- |
Source: Public Records
Mortgage History
| Date | Status | Borrower | Loan Amount |
|---|---|---|---|
| Open | Davis Hadlee R | $154,000 |
Source: Public Records
Tax History Compared to Growth
Tax History
| Year | Tax Paid | Tax Assessment Tax Assessment Total Assessment is a certain percentage of the fair market value that is determined by local assessors to be the total taxable value of land and additions on the property. | Land | Improvement |
|---|---|---|---|---|
| 2025 | $3,220 | $212,293 | $12,355 | $199,938 |
| 2024 | $3,220 | $234,951 | $12,355 | $222,596 |
| 2023 | $3,315 | $211,605 | $12,355 | $199,250 |
| 2022 | $3,201 | $174,408 | $12,355 | $162,053 |
| 2021 | $3,115 | $173,636 | $11,583 | $162,053 |
| 2020 | $3,088 | $173,636 | $11,583 | $162,053 |
| 2019 | $3,023 | $170,296 | $5,792 | $164,504 |
| 2017 | $2,562 | $140,312 | $5,792 | $134,520 |
| 2016 | $2,764 | $138,304 | $3,784 | $134,520 |
| 2015 | $2,123 | $105,331 | $3,740 | $101,591 |
| 2014 | $2,123 | $95,755 | $3,400 | $92,355 |
Source: Public Records
Map
Nearby Homes