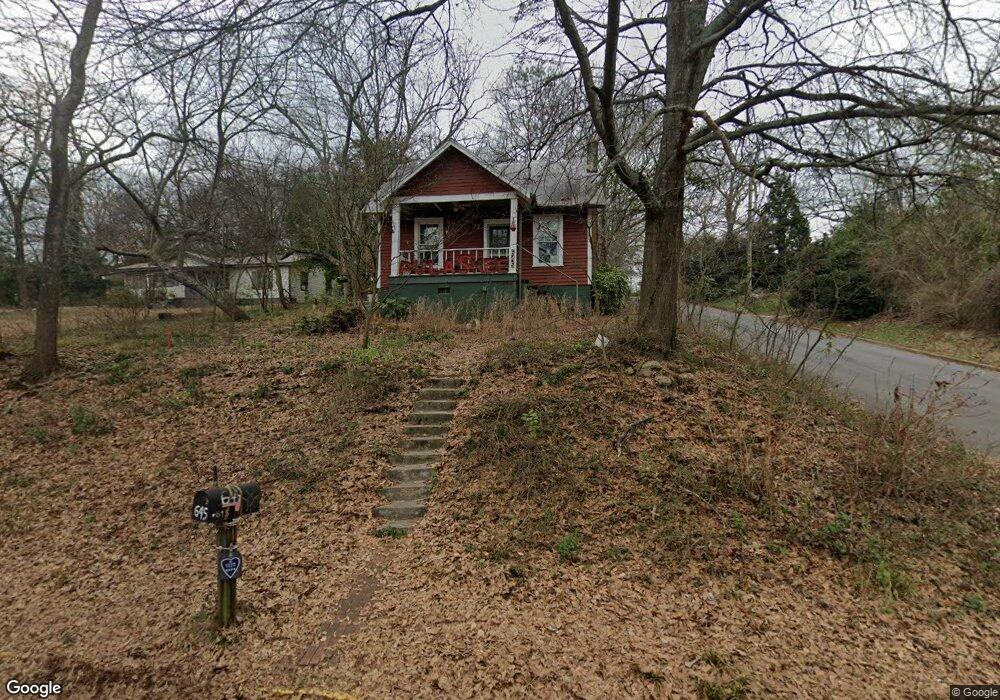
645 Pulaski St Athens, GA 30601
Newtown NeighborhoodEstimated Value: $408,546 - $525,000
--
Bed
--
Bath
1,469
Sq Ft
$322/Sq Ft
Est. Value
About This Home
This home is located at 645 Pulaski St, Athens, GA 30601 and is currently estimated at $473,387, approximately $322 per square foot. 645 Pulaski St is a home located in Clarke County with nearby schools including Barrow Elementary School, Clarke Middle School, and Clarke Central High School.
Ownership History
Date
Name
Owned For
Owner Type
Purchase Details
Closed on
Jan 28, 2009
Sold by
Hartness Charles C
Bought by
Hartness Charles C
Current Estimated Value
Purchase Details
Closed on
Apr 15, 2006
Sold by
Not Provided
Bought by
Hartness Charles C and Nancy Christine
Home Financials for this Owner
Home Financials are based on the most recent Mortgage that was taken out on this home.
Original Mortgage
$172,000
Interest Rate
6.31%
Mortgage Type
New Conventional
Purchase Details
Closed on
Nov 13, 1998
Sold by
Simmons Robert P and Simmons Paige G
Bought by
Lonnee Lonnee W and Lonnee Gina M
Purchase Details
Closed on
Jan 30, 1998
Sold by
Edens David E
Bought by
Simmons Robert P and Simmons Paige G
Purchase Details
Closed on
May 5, 1989
Sold by
Edens David E and Queen Joseph M
Bought by
Edens David E
Create a Home Valuation Report for This Property
The Home Valuation Report is an in-depth analysis detailing your home's value as well as a comparison with similar homes in the area
Home Values in the Area
Average Home Value in this Area
Purchase History
| Date | Buyer | Sale Price | Title Company |
|---|---|---|---|
| Hartness Charles C | -- | -- | |
| Hartness Charles C | $215,000 | -- | |
| Lonnee Lonnee W | $75,000 | -- | |
| Simmons Robert P | $39,500 | -- | |
| Edens David E | $800 | -- |
Source: Public Records
Mortgage History
| Date | Status | Borrower | Loan Amount |
|---|---|---|---|
| Previous Owner | Hartness Charles C | $172,000 |
Source: Public Records
Tax History Compared to Growth
Tax History
| Year | Tax Paid | Tax Assessment Tax Assessment Total Assessment is a certain percentage of the fair market value that is determined by local assessors to be the total taxable value of land and additions on the property. | Land | Improvement |
|---|---|---|---|---|
| 2025 | $3,511 | $195,282 | $40,000 | $155,282 |
| 2024 | $3,511 | $180,997 | $40,000 | $140,997 |
| 2023 | $3,542 | $167,896 | $40,000 | $127,896 |
| 2022 | $3,414 | $148,527 | $40,000 | $108,527 |
| 2021 | $3,337 | $129,364 | $40,000 | $89,364 |
| 2020 | $3,216 | $120,496 | $36,000 | $84,496 |
| 2019 | $3,143 | $113,299 | $36,000 | $77,299 |
| 2018 | $3,096 | $109,912 | $36,000 | $73,912 |
| 2017 | $0 | $95,094 | $36,000 | $59,094 |
| 2016 | $2,563 | $85,506 | $36,000 | $49,506 |
| 2015 | $2,462 | $82,398 | $36,000 | $46,398 |
| 2014 | $2,196 | $74,471 | $32,000 | $42,471 |
Source: Public Records
Map
Nearby Homes
- 668 Pulaski St
- 600 Pulaski St
- 145 Hendrix Ave
- 559 Pulaski St
- 100 Prince Ave Unit A404
- 100 Prince Ave Unit A407
- 270 Atlanta Ave
- 570 Prince Ave
- 697 Barber St
- 257 Hill St
- 195 Beulah Ave
- 269 N Hull St Unit 212
- 239 Madison Heights
- 250 W Broad St Unit 811
- 250 W Broad St Unit 521
- 250 W Broad St Unit 408
- 250 W Broad St Unit 615
- 131 E Broad St Unit 707
- 468 N Milledge Ave Unit 203
- 239 Ruth St Unit 15
- 635 Pulaski St
- 661 Pulaski St
- 141 Pulaski Heights
- 625 Pulaski St
- 630 Pulaski St
- 140 Pulaski Heights
- 120 Barrow St
- 615 Pulaski St
- 150 Pulaski Heights
- 130 Barrow St
- 175 Hendrix Ave
- 650 Pulaski St
- 160 Pulaski Heights
- 140 Barrow St
- 165 Hendrix Ave
- 675 Pulaski St Unit 2500
- 675 Pulaski St Unit 1
- 675 Pulaski St Unit 120
- 675 Pulaski St Unit 800
- 675 Pulaski St Unit 2200