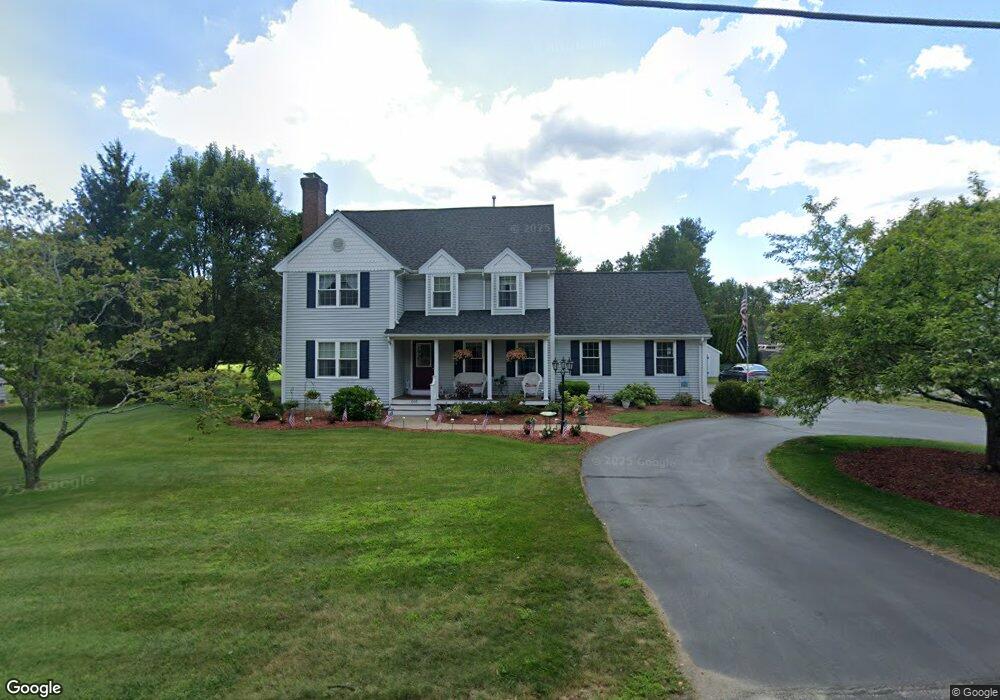
645 Read St Attleboro, MA 02703
Estimated Value: $601,000 - $671,000
3
Beds
3
Baths
2,017
Sq Ft
$313/Sq Ft
Est. Value
About This Home
This home is located at 645 Read St, Attleboro, MA 02703 and is currently estimated at $630,771, approximately $312 per square foot. 645 Read St is a home located in Bristol County with nearby schools including Hill-Roberts Elementary School, Robert J. Coelho Middle School, and Attleboro High School.
Ownership History
Date
Name
Owned For
Owner Type
Purchase Details
Closed on
Jun 25, 1999
Sold by
W B Constr & Dev Inc
Bought by
Kuffrey Russell D and Kuffrey Penny L
Current Estimated Value
Create a Home Valuation Report for This Property
The Home Valuation Report is an in-depth analysis detailing your home's value as well as a comparison with similar homes in the area
Home Values in the Area
Average Home Value in this Area
Purchase History
| Date | Buyer | Sale Price | Title Company |
|---|---|---|---|
| Kuffrey Russell D | $206,500 | -- |
Source: Public Records
Mortgage History
| Date | Status | Borrower | Loan Amount |
|---|---|---|---|
| Open | Kuffrey Russell D | $110,000 | |
| Closed | Kuffrey Russell D | $50,000 | |
| Closed | Kuffrey Russell D | $135,000 | |
| Closed | Kuffrey Russell D | $141,000 |
Source: Public Records
Tax History
| Year | Tax Paid | Tax Assessment Tax Assessment Total Assessment is a certain percentage of the fair market value that is determined by local assessors to be the total taxable value of land and additions on the property. | Land | Improvement |
|---|---|---|---|---|
| 2025 | $6,604 | $526,200 | $145,500 | $380,700 |
| 2024 | $6,426 | $504,800 | $145,500 | $359,300 |
| 2023 | $5,828 | $425,700 | $132,300 | $293,400 |
| 2022 | $5,566 | $385,200 | $126,100 | $259,100 |
| 2021 | $5,543 | $374,500 | $121,300 | $253,200 |
| 2020 | $5,310 | $364,700 | $117,700 | $247,000 |
| 2019 | $5,174 | $365,400 | $115,500 | $249,900 |
| 2018 | $4,991 | $336,800 | $112,100 | $224,700 |
| 2017 | $4,903 | $337,000 | $112,100 | $224,900 |
| 2016 | $4,824 | $325,500 | $109,900 | $215,600 |
| 2015 | $4,681 | $318,200 | $109,900 | $208,300 |
| 2014 | $4,609 | $310,400 | $104,700 | $205,700 |
Source: Public Records
Map
Nearby Homes
Your Personal Tour Guide
Ask me questions while you tour the home.